TokenOS AI Price Prediction 2026: Can TOS Break Higher?

A sudden double-digit swing just put TokenOS AI back on trader radars, and nobody expected the timing. Small-cap Solana tokens rarely move this fast without a reason. There's a pattern building underneath the noise, one that could decide where this token lands by December.
So what actually triggered it? Read on before drawing conclusions.
TokenOS AI price prediction 2026 starts with a token that just doubled in a single day. $TOS trades near $0.01802, up roughly 101.7% in 24 hours, with a market cap around $18.02M. Traders exploring a broader long-term price prediction hub will find this kind of swing familiar among low-cap AI tokens.
The trend still sits inside a descending channel. Current support holds near $0.0161, resistance near $0.0236. Volume matters more than price here.
TokenOS AI Price Prediction 2026
One number never tells the whole story for a token this thin.
2026 Scenario | $TOS Price Range | What Must Happen |
Bearish | $0.006–$0.012 | Support near $0.0161 breaks with weak buying |
Base | $0.014–$0.024 | Consolidation continues, volume stays flat |
Bullish | $0.030–$0.065 | Resistance clears with real volume growth |
Bearish isn't dramatic, just a slow bleed. Base case, per TOS market data, stays most likely. Bullish only holds if volume confirms it.
TOS Price Prediction for September 2026
As of September 15, 2026, 00:00 UTC, TOS trades near $0.01776. Support sits near $0.0161, resistance near $0.0236, the recent intraday high.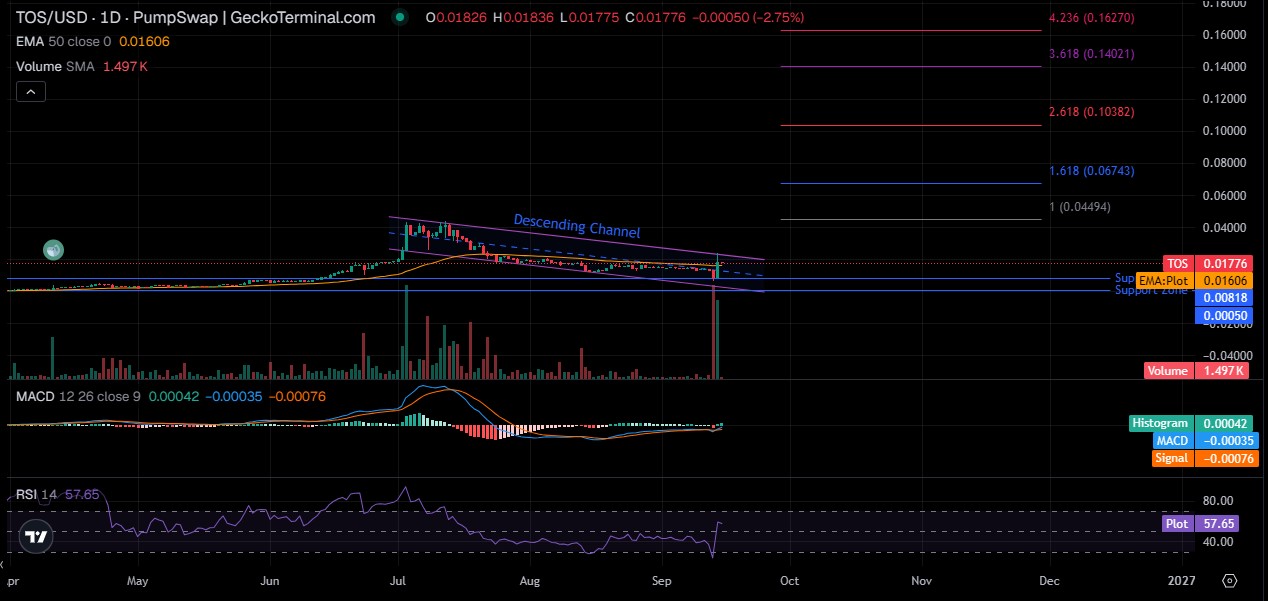
RSI reads near 57.65, neutral-to-bullish. MACD shows the histogram turning slightly positive, an early bullish crossover.
Blockspot's model for September 13 to 26 shows ranges widening well beyond the current price. Wide model ranges mean confidence in any single number should stay low.
Short-term target: $0.020 to $0.028, if volume holds.
TOS Price Prediction for October 2026
Expected range: $0.015–$0.032, support $0.0161, resistance $0.0270. Trend hinges on whether September's crossover holds, with catalysts tracked alongside exchange listing updates.
Bull trigger: trading above $0.024 with rising volume. Bear trigger: a break below $0.0161 that fails to reclaim within two days.
TOS Price Prediction for November 2026
Expected range: $0.016–$0.038, support $0.0161, resistance $0.0449, a Fibonacci extension level.
Trend could turn bullish with continued volume growth, tied to the broader Bitcoin direction and anything on the upcoming coin events calendar.
TOS Price Prediction for December 2026
Bear Case: $0.008, support breaks.
Base Case: $0.022, range trading persists.
Bull Case: $0.058, resistance clears with volume.
Year-end target: roughly $0.020 to $0.026, weighted toward the base case.
TokenOS AI Technical Analysis for 2026
$TOS Trend Analysis
TOS sits in sideways consolidation, wrapped inside a longer descending channel. Not bullish. Not fully bearish. But the recent volume spike suggests accumulation might be starting.
$TOS RSI Analysis
RSI near 57.65 is neutral-to-bullish, above the midline without touching overbought territory near 70. Turns out, that's a decent sign after a one-day gain this large.
$TOS MACD Analysis
The MACD line sits just below the signal line but closing the gap, with the histogram turning slightly green. An early-stage crossover, not a confirmed one.
$TOS Volume Analysis
This is where things get honest. Reported 24-hour volume runs near $277,919, thin for an $18M market cap.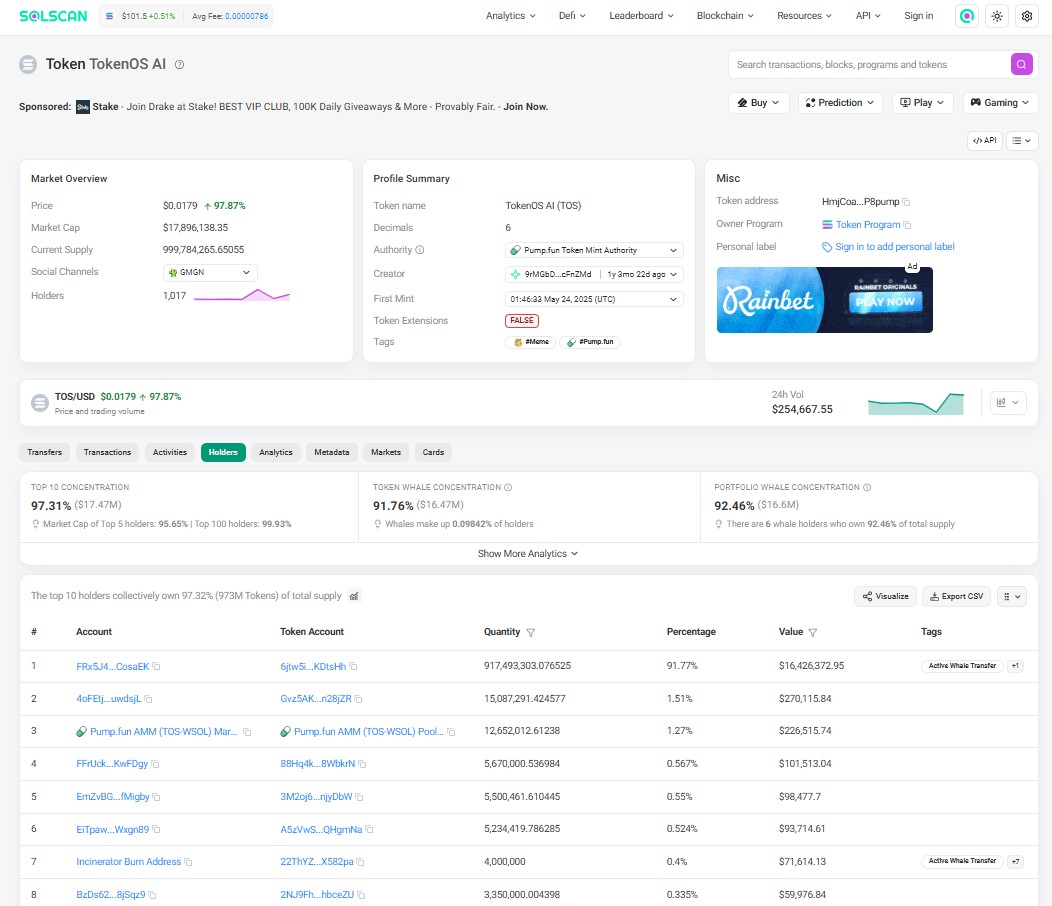
On-chain holder data shows the top ten wallets holding over 97% of supply. Heavy concentration.
Breakout plus low volume means weak confirmation. Breakout plus strong volume means something traders can trust. TOS leans toward the first version right now.
TOS Support and Resistance Levels in 2026
Key Support Levels
S1: $0.0161. S2: $0.0082. S3: $0.0059.
Key Resistance Levels
R1: $0.0236. R2: $0.0449. R3: $0.0674.
$TOS Breakout Level
Sustained trading above $0.0236 with above-average volume confirms bullish momentum returning.
$TOS Invalidation Level
A drop below $0.0161 holding for a day or two invalidates the near-term bullish setup.
Can TOS Reach $0.05 in 2026?
Not automatically. $0.05 times roughly 999.78M circulating supply implies a $50M market cap, versus $18.02M today, about a 177% increase.
Plausible with fresh memecoin market updates shifting sentiment, but it needs sector-wide momentum, not just $TOS alone.
Can TokenOS AI Reach $0.10 in 2026?
Same math, bigger number. $0.10 times roughly one billion tokens implies a $100M market cap, close to a 455% increase from here. Possible, but unlikely without a major catalyst and real ecosystem traction.
$TOS Bull Case for 2026
Resistance breakout above $0.0236 with rising volume, improved liquidity, a stronger crypto market, compute-network development, positive listing catalysts, and Bitcoin holding a supportive trend.
$TOS Base Case for 2026
The realistic path, not the exciting one: consolidation between $0.014 and $0.024, slow adoption, range-bound trading, limited liquidity, and a gradual, uneven recovery.
TOS Bear Case for 2026
Support breakdown below $0.0161, persistently low liquidity, volume deterioration toward pre-spike levels, broader market weakness, negative project news, and large-holder selling, which, given that concentration data, remains a real risk.
What Could Drive TOS Price in 2026?
Exchange listings, compute-network development, ecosystem growth across Solana AI projects, partnerships bringing real liquidity, tokenomics shifts, and any airdrop tracking page activity. Market sentiment and Bitcoin's direction matter too, since alts rarely decouple for long.
$TOS Price Prediction 2026: Final Outlook
Scenario | 2026 Target | Key Condition |
Bear | $0.008 | Support breakdown |
Base | $0.022 | Range holds |
Bull | $0.058 | Breakout + volume |
Trader takeaway: TOS stays constructive only while it holds $0.0161. A breakout above $0.0236 with stronger volume could open a path toward $0.045, while a breakdown below $0.0161 weakens the 2026 bullish thesis. Fine. That's the setup. Live chart watchers can track it on the live trading chart.
Disclaimer
This article is for informational purposes only and does not constitute financial, investment, or trading advice. Cryptocurrency markets, especially low-cap tokens like TokenOS AI, carry substantial risk, including the possibility of total loss. Price predictions rely on current data and technical patterns, both of which can change quickly. Independent research and professional guidance are recommended before making any financial decisions.











.jpg)






