Bitcoin, Ethereum, XRP Are Surging Right Now. Here's the Real Reason


Bitcoin just clawed its way back toward $78,000, and it's dragging the rest of the market up with it.
Three weeks ago, this looked like a very different story. BTC had cratered from its August high near $81,500.
Ethereum and XRP got dragged down with it. Today, ETH is back above $2,500. XRP has clawed back to $1.38 after bouncing hard off $1.35 support.
So what changed? Nothing has actually happened yet; that's the twist. Traders are betting ahead of three separate events landing almost on top of each other this week: a Senate vote, a Fed decision, and a central bank meeting in Tokyo.
The market is pricing in outcomes before anyone's even walked into the room.
Three Events, Four Days: What's Actually on the Calendar
Tuesday, September 15: The Senate votes. The CLARITY Act faces a procedural cloture vote. Senator Cynthia Lummis has been teasing that "big things are coming," and crypto traders are reading that as a signal about this exact bill.
Wednesday, September 16: The Fed decides. Two days of meetings wrap up, right on the heels of a fresh CPI print.
Friday, September 18: Tokyo moves. The Bank of Japan meets, and a rate hike is on the table. If the yen strengthens, that could choke off the carry trade that's been quietly fueling crypto's upside for months.
Four days. Three unrelated institutions. One market watching all of them at once.
The Fed Odds Just Flipped, Hard
A month ago, a rate hike was basically a coin flip. Not anymore.
The CME FedWatch Tool now puts the odds of a 25 basis point hike at 86.5% for Wednesday's meeting. Just 13.5% of traders expect no change.
Target Rate (bps) | Now | 1 Day Ago | 1 Week Ago | 1 Month Ago |
350-375 (current) | 13.5% | 12.7% | 40.6% | 66.1% |
375-400 (hike) | 86.5% | 87.3% | 59.4% | 33.9% |
Four weeks ago, markets leaned toward no change, 66.1% to 33.9%. That's now almost a complete reversal. The current target rate sits at 350-375 basis points, and the ZQU6 contract (expiring September 30) carried prior volume of 114,611 and open interest of 247,973.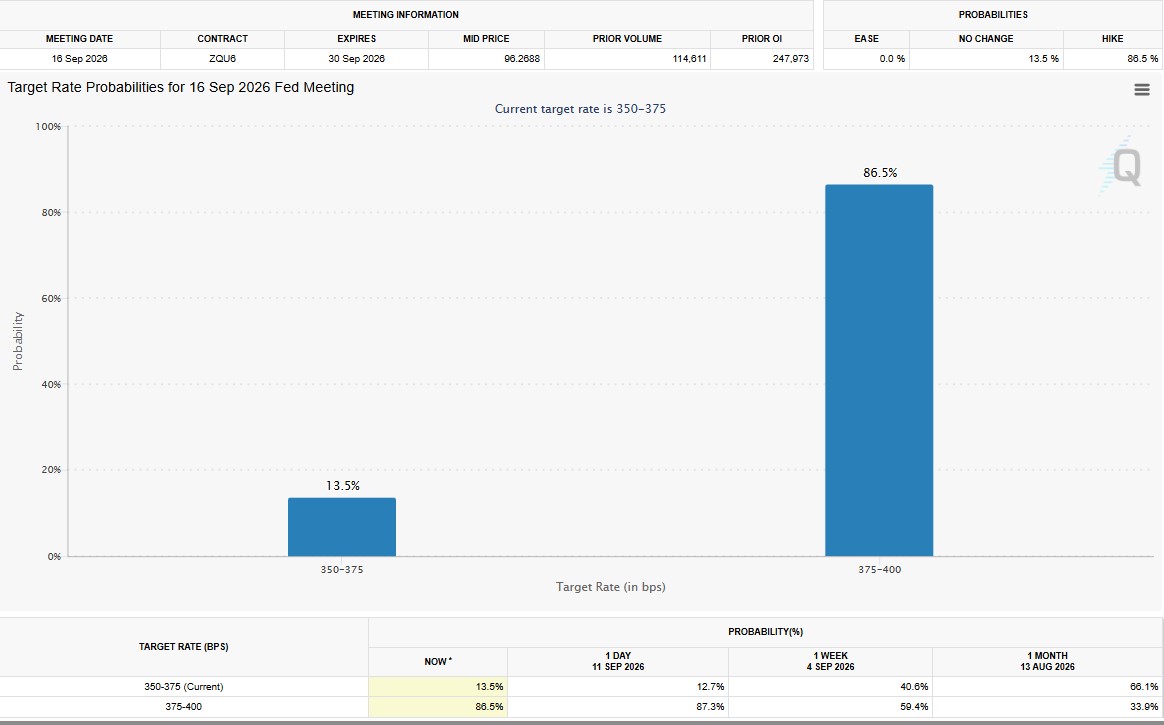
This repricing alone has been enough to keep a lid on Bitcoin, Ethereum, and XRP, even before the Fed says a single word Wednesday. If the hike isn't fully priced in by then, the announcement itself could still sting.
Sentiment Is Cooling, But Not Cold
The Crypto Fear and Greed Index sits at 57 today, September 14, still in Greed territory, but a step down from yesterday's 61 and well off last week's 71.
Zoom out further, and the picture looks better: a month ago, the index was buried at 34, deep in Fear. So overall sentiment has swung positive; it's just losing a little steam heading into Wednesday, which tracks with traders getting cautious ahead of the Fed.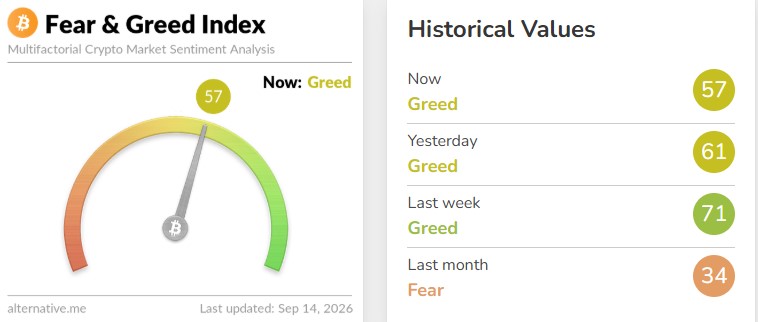
$177 Million Wiped Out in 24 Hours
The last day hit leveraged traders hard. According to CoinGlass, $177.33 million in positions got liquidated: $114.98 million in longs, $62.35 million in shorts.
Ethereum took the biggest hit: $38.15 million liquidated, mostly longs getting flushed. Bitcoin followed at $30.28 million. LSK lost $14.50 million, ZEC lost $9.64 million, and everything else combined added another $23.94 million.
The pain accelerated fast. In the last hour alone: $11.70 million liquidated, $10.59 million of it longs. Over four hours: $30.81 million. Over twelve hours: $116.33 million, split into $79.51 million longs and $36.83 million shorts.
Roughly 73,735 traders got liquidated in a single day. The single biggest casualty: a $4.46 million ETHUSDT order on Binance.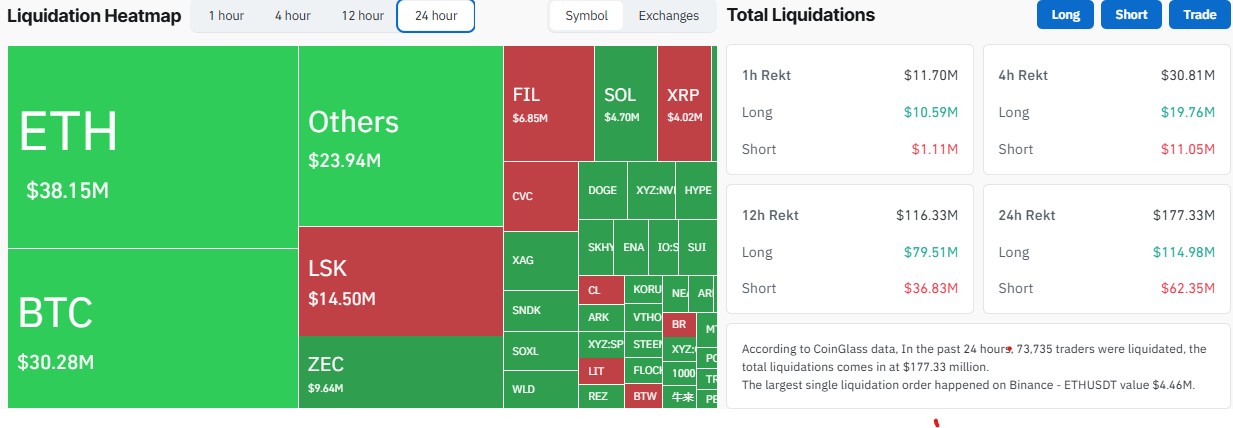
ETF Money Is Sending Mixed Signals
Something shifted in the ETF flows last week, and analytics account Wu Blockchain caught it.
From September 7-11, spot Bitcoin ETFs bled $463 million in net outflows, snapping a three-week streak of inflows.
Ethereum ETFs told the opposite story: $197 million flowed in, extending their inflow streak to four straight weeks. Solana ETFs pulled in $10.3 million. XRP ETFs added $18.98 million.
Total Bitcoin ETF assets stood near $97.6 billion at the time of that snapshot, with BTC trading around $77,286. Translation: institutional money is rotating, not fleeing, and it's rotating toward Ethereum.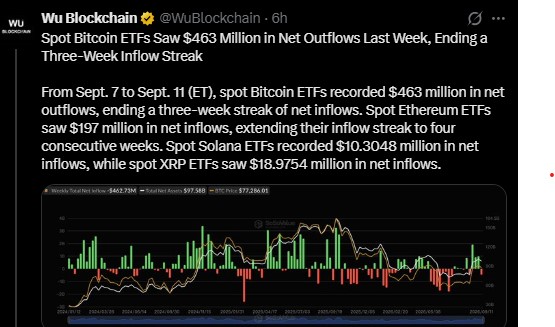
Can Ethereum Actually Hit $3,000?
The chart tells a genuinely bullish story. ETH bottomed between $1,900 in June and July, broke out sharply, and now trades between $2,400 and $2,520, holding above its 20 EMA near $2,439, with the 50-, 100-, and 200-day averages sitting well below.
Here's the map traders are watching:
Close above $2,520-$2,530: path opens toward $2,650-$2,750
Break past that: $2,850-$3,000 comes into view
Lose $2,400: risk of a slide to $2,300-$2,265
Break below $2,265: the bullish case falls apart
There's a technical wrinkle worth watching too. Analyst Ali Charts has flagged a repeating triangle pattern on the 12-hour chart. Last time this exact pattern broke out, ETH ripped 31% in three days.
A second triangle has now formed, with ETH sitting just under resistance near $2,474. If history repeats, $3,000 isn't a stretch, but repeat patterns break down just as often as they break out. This is a setup, not a guarantee.
XRP's Whales Are Selling. Here's Why That Might Not Matter.
XRP has dropped 20% in three weeks, sliding from $1.70 to near $1.35. Some of that is straightforward profit-taking: whale wallets moved roughly 90 million XRP off the table in the past week alone.
Network activity backs that up. Daily active addresses collapsed 90.18%, from 388,492 down to just 38,163.
And yet, XRP is holding. It's found support at $1.35, a level where 2.29 billion tokens previously changed hands, which tends to act like a floor.
Chart analyst Ali Charts is watching a descending triangle on the hourly chart, with lower highs compressing into the $1.31-$1.35 zone. The number that matters: $1.38.
Reclaim it, and the setup points toward the triangle's apex, with room to run toward $1.60 and possibly $1.68. Lose the $1.31 floor instead, and the triangle likely breaks down, opening the door lower.
The $1.31-$1.38 range isn't just a technical detail. It's probably where this week's three catalysts (the Senate vote, the Fed call, and the BOJ meeting) will leave their fingerprints most clearly.
Bitcoin's Fork in the Road
Bitcoin is sitting at a genuine crossroads, and the chart backs both scenarios.
The bearish case: BTC's daily structure is still printing lower highs and lower lows. Fail to reclaim $83,000, then $68,000-$69,000 comes back into play, with $62,000-$64,000 possible below that.
The bullish case: If the CLARITY Act clears Tuesday and BTC breaks $84,000, that could be the move that finally kills the four-year cycle narrative traders have leaned on for years.
A confirmed daily close above $83,000 would flip the bearish setup on its head.
Did You Miss the Bottom? Maybe Not.
If you watched Bitcoin sit below $60,000 and didn't buy, the run to $77,000-$80,000 probably stings a little.
But history offers a pattern worth knowing. Across the 2022-2025 bull cycle, every time Bitcoin touched or dipped below its short-term holder cost basis, it marked a genuine buying opportunity before the next leg higher.
That level sits near $71,200 right now. Instead of chasing the current price, plenty of traders are watching that number as the next real entry point, not $78,000.
Disclaimer
This article is for informational purposes only and does not constitute financial, investment, or trading advice. Cryptocurrency prices are highly volatile, and past performance does not guarantee future results. Always do your own research and consult a licensed financial advisor before making investment decisions. The author and publisher are not responsible for any losses incurred from trading decisions based on this content.











.jpg)






