Why Is Crypto Down Today? BTC, ETH, XRP Slip Trump Rejects Iran Plan


Why is crypto down today? The short answer is Iran. U.S. President Donald Trump rejected an Iranian proposal tied to the Strait of Hormuz, and risk assets took a hit.
Bitcoin slipped near $83,000 at the time of writing after briefly topping $85,000. Ethereum struggled near $2,650, while XRP stayed below $1.50. The total crypto market cap fell 1.85% to about $2.84 trillion, per CoinMarketCap.
How Much Did Bitcoin, Ethereum and XRP Fall?
Asset | Now | Last Week |
Bitcoin (BTC) | Near $83,000 | Above $87,000 |
Ethereum (ETH) | Near $2,650 | Above $2,800 |
XRP | Below $1.50 | Below $1.50 |
The dip interrupted the September rebound.
What Did Trump Say About Iran and the Strait of Hormuz?
Iran offered a plan at the UN General Assembly. It called for a seven-day period to reopen the Strait of Hormuz and pause fighting before talks.
Trump rejected it. He said Iran wants a deal because of military and economic pressure. He also wrote that Iran "cannot have a nuclear weapon."
He said the conflict should end "very soon" but would not rule out new strikes before the November midterms.
Foreign Minister Abbas Araghchi said Iran is open to diplomacy and "fully prepared" if fighting resumes. No new military action has been confirmed.
WTI crude traded above $93 in Monday's early session. Hormuz is a major route for Gulf oil and liquefied natural gas.
Why Is Crypto Down Today? The Oil, Yields and Fed Link
Higher oil can lift inflation worries and bond yields. The 10-year Treasury yield has moved above 5% since the conflict began.
When yields rise, riskier assets like crypto often lose appeal. It is one clear reason, though not the only one.
How Much Was Liquidated in the Crypto Market Today?
CoinGlass data shows about $330.18 million liquidated in 24 hours. A total of 107,013 traders were hit, and longs took most of the pain.
Liquidations (24h) | Amount |
Total | $330.18 million |
Longs | $230.65 million |
Shorts | $99.53 million |
Bitcoin | $79.24 million |
Ethereum | $51.93 million |
XRP | $16.05 million |
The biggest single order was a $6.54 million BTCUSDT trade on Binance.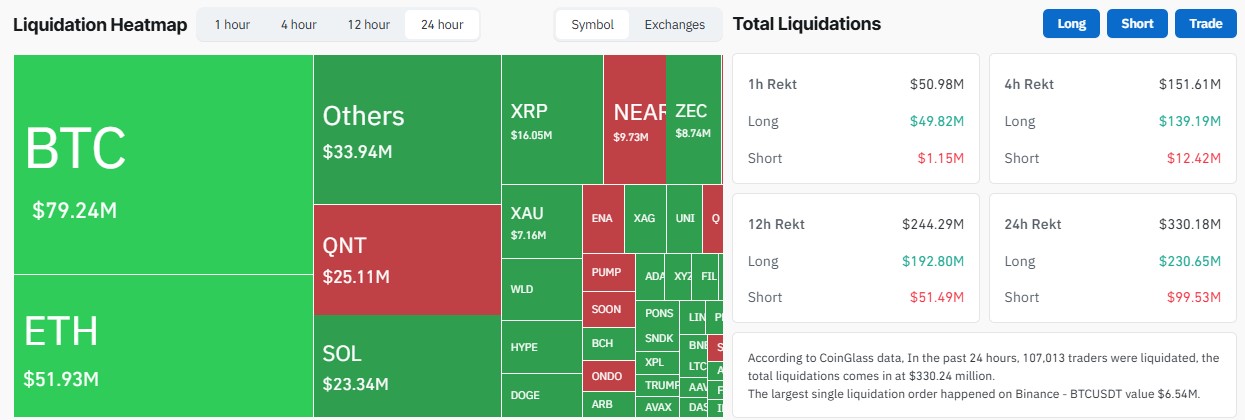
Will the Fed Raise Interest Rates in October 2026?
CME FedWatch shows a 68.1% chance of a hike to 400-425 bps on October 28, 2026. No change at 375-400 bps sits at 31.9%. A cut is at 0%.
Target Rate | Now | 1 Day Ago | 1 Week Ago | 1 Month Ago |
375-400 bps (current) | 31.9% | 35.8% | 42.4% | 52.7% |
400-425 bps | 68.1% | 64.2% | 57.6% | 17.7% |
A month ago, a hike was only 17.7%. That shift is a headwind for crypto.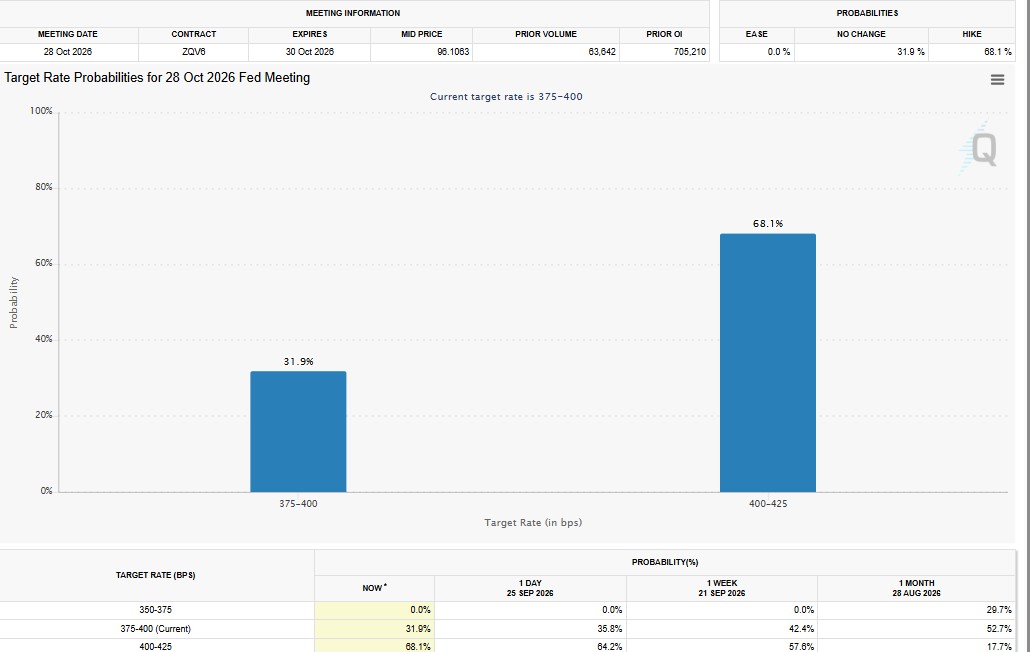
What Is the Crypto Fear and Greed Index Today?
The index reads 74, or "Greed." It was 70 yesterday and last week, and 68 last month.
So why is crypto down today if sentiment is still upbeat? Prices can slip while traders stay hopeful. Some see a caution sign. Others see dip buyers at work.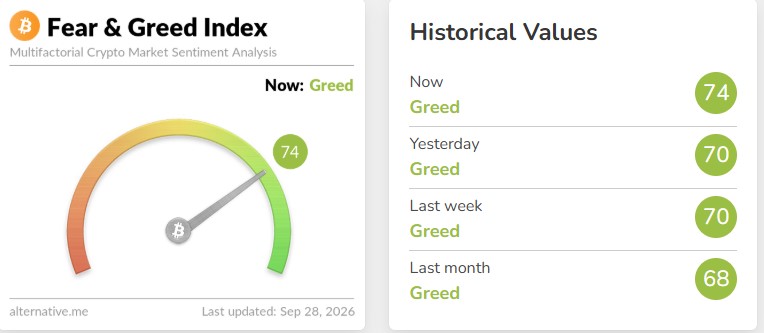
What Is the Bitcoin Price Prediction and Key Levels?
Analyst Michaël van de Poppe says $84,800 is key resistance. "If that breaks, I think that we'll see a continuation towards the $90,000 levels," he said.
Aksel Kibar said the weekly candle near $84,000 to $85,000 "does not look like a decisive breakout." Hesitant price action, he added, could send price back into the range.
Ethereum Price Prediction: Key Support and Resistance Levels
ETH trades above its rising 20-day average near $2,602. The daily RSI is about 62, which is firm but not overheated.
Level | Type |
$3,366 | Resistance |
$2,970 | Resistance |
$2,807 | Resistance (major daily line) |
$2,602 | Support (20-day average) |
$2,426 | Support (50-day average) |
$2,265 to $2,259 | Support (100-day and 200-day averages) |
$2,149 | Support (horizontal floor) |
Under that floor, a rising trendline from the June lows sits near $1,500 to $1,550.
Will Ethereum Go Up? ETH Bullish Case
ETH broke out of a $2,400 to $2,550 range earlier this month. On the 4-hour chart, a break above $2,560 and a retest point to $2,637, then $2,760.
Holding $2,600 to $2,550 and clearing $2,807 could open $2,900 to $3,000. On the weekly chart, some watchers see $3,200 to $3,600. A weekly close above $2,800 could push toward $3,400.
Will Ethereum Fall? ETH Bearish Case
The risk is rejection at resistance. Smaller candles show some profit-taking.
A close below $2,602 could send ETH to $2,426, then $2,260 and $2,150. Falling under $2,550 would weaken the breakout story.
What Should Ethereum Traders Watch Next?
Whether ETH closes above $2,807 with strong volume
Whether $2,600 holds on any dip
Whether whale buying continues or slows
These are possible paths, not promises.
XRP Price Prediction: Can XRP Break $1.50?
XRP has spent about six weeks trying to reclaim the 50-week EMA and clear the $1.50 to $1.60 wall. Sustained closes above the 50-week EMA would help the case for $1.80 to $1.90.
One chart setup shows a breakout from a long-term consolidation pattern. If it holds, the pattern points to $15 or higher, a gain of more than 874% from the chart's marked levels.
This is only a technical projection, not a guaranteed outcome. XRP could reverse if the breakout fails.
What Economic Data Is Due This Week?
Date | Release | Time |
Sept. 30 | August personal income, spending, and PCE index | 8:30 a.m. ET |
Oct. 2 | September employment report | 8:30 a.m. ET |
Same week | ISM manufacturing report | Not stated |
PCE is the Fed's preferred inflation gauge. The ISM report gives another read on U.S. activity, which can move yields and Fed bets.
Disclaimer
This article is for information only. It is not financial, investment or trading advice. Crypto prices are volatile, and you can lose money. Price levels and forecasts mentioned here are not guarantees. Do your own research and speak with a licensed financial advisor before making any decision.

















