Hedera Price Prediction October 2026: UK AI News Meets HBAR Breakout


Hedera price prediction October 2026 is shaping up as one of the more interesting setups on the daily charts.
HBAR has gone quiet after a sharp burst higher, and quiet markets tend to be loud right before they move.
Add a fresh AI headline to the mix, and the stage looks set for something. Here is the full picture.
Editorial note: our desk holds no personal position in HBAR. This is purely a chart and data read.
Hedera Price Today: Live HBAR Price and Market Data
Hedera is trading at 0.0966, up 3.23% over the last 24 hours. Market cap stands at $4.17B, with open interest at $165.22M.
Futures volume reached $191.46M against spot volume of $66.48M, so derivatives traders lead the action.
Circulating supply is 43.83B HBAR out of a 50.00B total and maximum. For a look at a different large-cap setup, see our Chainlink price prediction analysis.
Source: CoinGlass, Sep 28, 2026
Hedera News Today: UK Publishes Official AI Guidance
An X post from ALLINCRYPTO (@RealAllinCrypto) says the UK government has published official guidance for more responsible and sustainable AI use, and it tags HBAR in the headline. 
The guidance reportedly tells users to apply AI only when needed, pick smaller models where possible, keep prompts to a minimum, and be open when AI helps create content.
The post is cut off in the visible text, so the exact link to Hedera is not spelled out here.
Treat it as a narrative catalyst rather than a confirmed partnership. Readers following this theme can also browse our best AI crypto tokens list.
Source: ALLINCRYPTO (@RealAllinCrypto) X post, Sep 28, 2026, posted about 9 hours earlier
Quick Take
CMP: 0.09621 (daily chart, Binance)
Bullish trigger: daily close above 0.10988
Failure level: daily close below 0.07190
Data timestamp: Sep 28, 2026, 11:21 UTC+5:30
Risk note: triangles can break either way, so wait for the close.
Hedera Price Prediction October 2026 Technical Analysis
HBAR spent most of September crawling sideways in a low range, with the 0.07190 zone marking the floor of that base. Around the 19th, buyers took over. 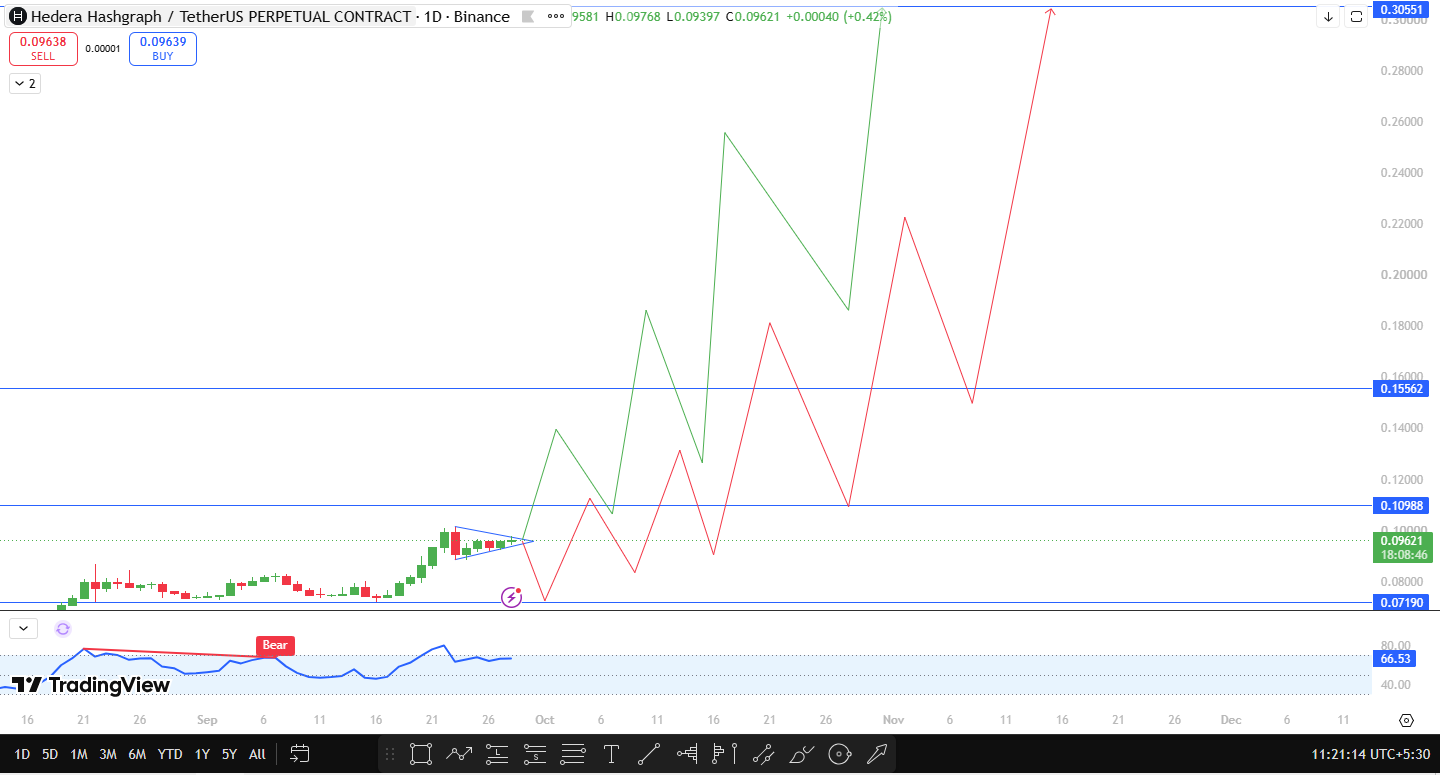
A run of strong daily candles pushed the price toward 0.10000 in just a few sessions, one of the cleaner impulse moves on the chart. Since then, price has stopped running and started compressing.
That compression has drawn a symmetrical triangle. The highs are getting lower, the lows are getting higher, and the daily candles are shrinking as the two lines squeeze together.
After a sharp rally, this kind of structure often works as a breather where the market decides Hedera's next direction. The oscillator reads 66.53, elevated but not stretched, which shows buyers still have some strength left.
A bearish divergence label sits back in early September, but price has since moved on from it.
The bullish trigger is a daily close above 0.10988. Only a close, not a wick, would confirm that the triangle has broken and that buyers have taken control from the squeeze.
From there the next HBAR resistance level is 0.15562, and 0.30551 is the extended target marked on the chart. Expect pullbacks along the way, since a move that size rarely travels in a straight line.
The chart also allows for a deep pullback first. Sellers could push the price down toward 0.07190, the major HBAR support level and the floor of the September base.
A retest there would not automatically kill the idea, since buyers defended the zone before. But a daily close below 0.07190 would invalidate the whole structure and remove the bullish case.
Between 0.07190 and 0.10988, patience matters more than prediction.
Source: TradingView, HBAR/USDT perpetual, 1D, Binance, Sep 28, 2026, 11:21 UTC+5:30
Hedera Support and Resistance Levels
Level | Type | Distance from CMP (0.09621) |
0.30551 | Extended resistance | +217.55% |
0.15562 | Next resistance | +61.75% |
0.10988 | Breakout trigger | +14.21% |
0.07190 | Major support and invalidation | -25.27% |
Bull, Base, and Bear Scenarios for HBAR
Bull case. HBAR closes above 0.10988 on the daily chart, confirming the triangle breakout. The impulse that started around the 19th would then have a second leg, targeting 0.15562 first.
If that level gives way, 0.30551 opens up. Traders checking the broader picture can read our Bitcoin price outlook this week.
Base case. Price keeps tightening inside the triangle for several more sessions. Volume stays modest, the oscillator drifts near current levels, and neither side commits. With the lines still converging, this is the most likely near-term outcome.
Bear case. A deeper pullback drags HBAR toward 0.07190. The chart treats that as a possible retest rather than a failure, as long as buyers defend it. A daily close beneath it ends the setup and would force a rethink of the whole trend.
Risks to Watch
Futures volume is nearly three times spot volume, so liquidation cascades can push price around without any real change in demand.
The UK guidance story is a social media post with an unclear link to HBAR, and narrative rallies can fade fast.
A drop to 0.07190 would mean a decline of about 25%, which is a lot for anyone caught on the wrong side. Broader sentiment, including our Hyperliquid price forecast update, can also override any single chart.
Hedera 2030 Price Outlook
If governments keep publishing rules for how AI should be used, networks that promise transparency and traceable records have a real pitch.
Hedera fits that description, and with 43.83B of 50.00B HBAR already circulating, supply expansion is limited. Our 2030 estimate for HBAR is 0.45.
Glossary
Symmetrical triangle: converging trendlines that squeeze price before a breakout.
Invalidation: a level where the trade idea is no longer valid.
Open interest: the total value of open futures contracts.
Disclaimer
This article is for educational and informational purposes only and is not financial advice. Crypto assets are highly volatile. Do your own research before making any trading decision.

















