Why Is Crypto Market Up Today: Bitcoin, Ethereum, and XRP Prices Rally


Why is Crypto Market Up Today: Why BTC, ETH, XRP Price Rally?
If you're asking why is crypto market up today, the short answer is Bitcoin broke a key price level and dragged the rest of the market with it. The total crypto market is up 4.83% in the last 24 hours, now sitting at $2.88 trillion.
Bitcoin price today jumped 5.55% and moved above $85,000. Ethereum price today is also higher, up 6.11% at $2,743. XRP price today gained 6.88% to reach $1.47.
Solana is trading near $116.50, up about 7%. It's a green day across the board, and traders are asking whether this rally has legs.
Why Is Crypto Up Today? Bitcoin, ETF Inflows & Regulation Explained
Bitcoin holding above a key weekly moving average for the first time in months is the main story. That kind of technical move tends to pull buyers back into the market.
There's also fresh money coming in. Spot Bitcoin ETFs recorded about $433 million in net inflows on the day, adding real demand behind the price move.
Ethereum ETFs saw $143.8 million in daily inflows too, though the broader week still closed with around $140 million in net outflows.
Looking at the weekly picture, spot Bitcoin ETFs pulled in about $6.21 million in net inflows from September 14 to 18. BlackRock's IBIT led that stretch with $121 million, showing Bitcoin ETF demand stayed steadier than Ethereum's over the week.
On top of that, last week brought some regulatory clarity. The SEC's new framework for tokenized U.S. stocks, plus the 2026 SEC/CFTC rules classifying major crypto assets as digital commodities, gave institutions a clearer picture to work with.
Crypto Fear and Greed Index Today: Is the Market in Greed?
The Crypto Fear & Greed Index is at 70 right now, which puts the market in Greed territory.
That's down slightly from 71 yesterday, but well above last week's reading of 57. A month ago, the index also stood at 71.
Period | Fear & Greed Score | Sentiment |
Now | 70 | Greed |
Yesterday | 71 | Greed |
Last week | 57 | Greed |
Last month | 71 | Greed |
This tells us traders have been feeling good about crypto for a while now, even with some ups and downs along the way.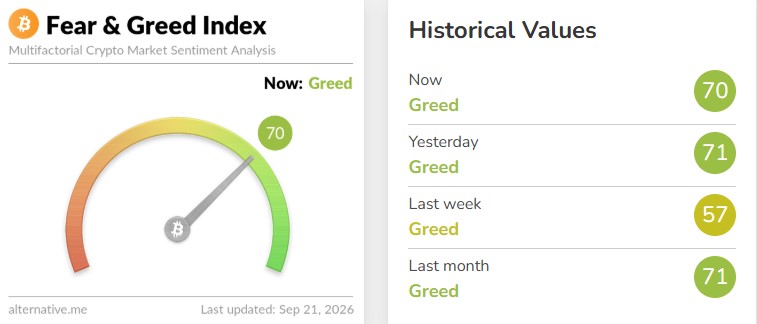
Crypto Liquidations Today: How Much Got Wiped Out?
Big rallies often come with big liquidations, and today is no different.
According to CoinGlass data, total crypto liquidations hit $746.99 million over the past 24 hours. That affected 136,762 traders.
Short positions took the biggest hit, losing $648.49 million. Long positions lost a smaller $98.49 million.
Liquidation Window | Total | Long | Short |
1 hour | $163.76M | $7.15M | $156.61M |
4 hour | $433.09M | $19.95M | $413.14M |
12 hour | $579.02M | $51.05M | $527.97M |
24 hour | $746.99M | $98.49M | $648.49M |
Bitcoin led the liquidation chart with $359.90 million wiped out. Ethereum came in second at $170.15 million.
The single largest order was on Binance, a BTCUSDT trade worth roughly $11.29 million.
Looking at the wider derivatives market, total liquidations reached $1.08 billion, split between $473.28 million in longs and $613.6 million in shorts. Open interest dropped 6.93% to $412.82 billion, even as trading volume jumped 55.85% to $888.32 billion. More volume with less open interest usually means traders are closing positions fast, not just piling in.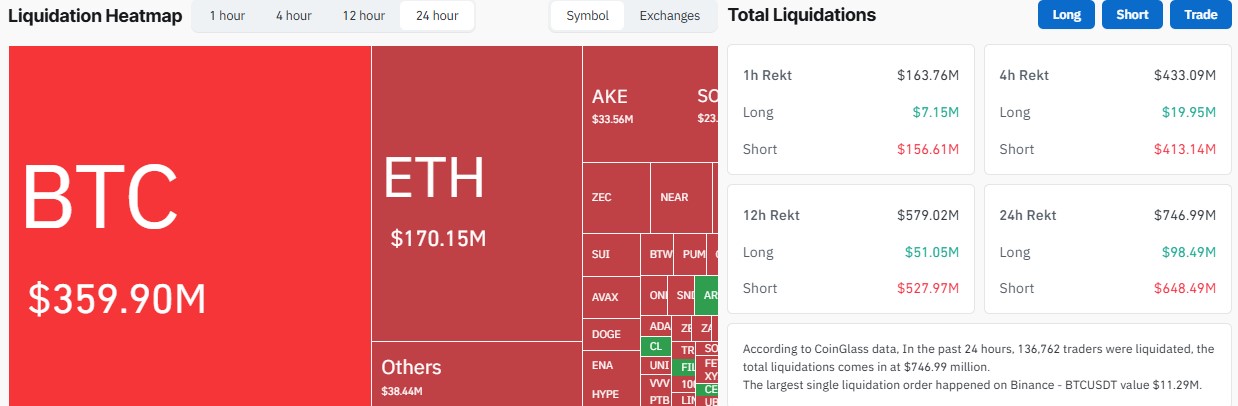
Bitcoin News Today: Saylor's Latest Buy and Russia's Crypto Shift
Michael Saylor posted again about Bitcoin buying, saying "a little more orange," which is his usual signal that Strategy (formerly MicroStrategy) may add to its Bitcoin stack. The firm's total holdings are already worth close to $67.90 billion.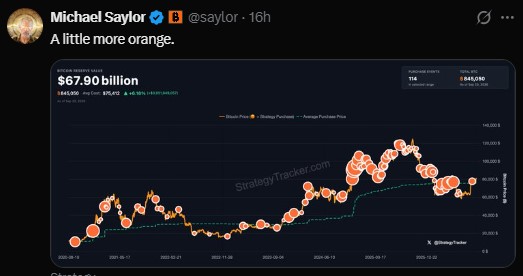
Elsewhere, Russia is opening up crypto access through major banks. Reports suggest the country could see up to 10 million new crypto users by 2027.
That's a notable contrast with the U.S., where the CLARITY Act has still not passed.
Bitcoin Price Prediction: Is $100K Next After Breaking $85K?
Bitcoin had been rejected from the $83,000 level a few times before. Today it finally broke through on strong volume, hitting a high near $85,250.
Some chart watchers say a weekly close above $83,000 could open the door toward $88,000 to $92,000. A further stretch target sits at $96,000 to $100,000.
If Bitcoin fails to hold above $85,000, the $83,000 zone becomes the next support to watch, since resistance often flips into support once it's broken.
This is not a guarantee, just a possible path based on current chart structure.
Ethereum Price Prediction: Will ETH Hit $3,600?
Ethereum news today points to a strong technical setup. On the 4-hour chart, ETH broke above $2,560, retested that level, and pushed toward $2,637.
If that structure holds, $2,760 is the next level traders are watching.
Level | Price Zone | What It Means |
Key support | $2,560 | Retested support after the breakout |
Near-term target | $2,760 | Next major level on the 4-hour chart |
Weekly support 1 | $1,900 | First key level if ETH falls back |
Weekly support 2 | $1,500 | Deeper support if the rally fails |
Upside target | $3,200 – $3,600 | Possible zone if the weekly breakout holds |
On the weekly chart, Ethereum broke out of a multi-week trading box. If that breakout sticks, some analysts see room toward $3,200 to $3,600.
Staking demand has also stayed strong, which adds some support to the bullish case. Still, this is chart-based speculation, not a promise of where price goes next.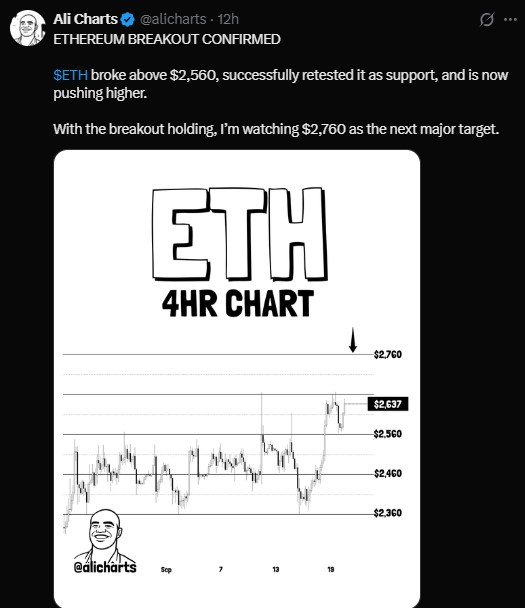
XRP Price Prediction: Will XRP Hit $2?
XRP news today includes a rare technical signal. XRP's "bull switch" fired for only the fourth time in its history, with the 50-week EMA sitting around $1.51.
The main target for XRP bulls is clearing the $1.80 zone, where the Gaussian Channel midline also sits.
On the daily chart, XRP looks like it's forming the right shoulder of an inverse head-and-shoulders pattern. That's a setup some traders watch for signs of a bigger move.
The neckline to watch is near $1.55. A confirmed break above that level could point toward a move near $2, though nothing here is guaranteed.
What Could Move Crypto Prices This Week? Fed Speakers, PMI & More
A few macro events could shake things up over the next few days.
There are eight Fed speaker events on the calendar this week. Traders will also watch ADP Employment data on Tuesday, PMI numbers on Wednesday, New Home Sales on Thursday, and Durable Goods Orders on Friday.
Geopolitics matters too. Developments tied to Ukraine, Russia, and Iran could affect oil prices and overall risk appetite.
Crypto's correlation with the Nasdaq is sitting around 61% right now, so stock market moves tied to Trump-Xi trade talks could spill over into crypto prices as well.
Bottom Line: Is the Crypto Rally Sustainable?
Bitcoin's break above $85,000, paired with ETF inflows and a clearer regulatory picture, is behind today's crypto rally. Ethereum and XRP are riding the same wave with their own bullish chart patterns forming.
Still, with $746.99 million in liquidations in the past day alone, this market can turn fast in either direction. Anyone trading right now should watch both the technical levels and the macro calendar closely this week.
Disclaimer
This article is for informational purposes only and should not be considered financial or investment advice. Cryptocurrency markets are highly volatile and carry significant risk. Prices mentioned are subject to change rapidly. Always do your own research and consult a licensed financial advisor before making any investment decisions.


















