Why Is Crypto Market Up Today? BTC, ETH, XRP News and Price Prediction


Why is crypto market up today? In today's crypto news, the market is moving higher as easing geopolitical tension gives traders room to buy. Bitcoin price today has pushed above $87,000, and the mood across the board has turned bullish again.
If you're asking why is crypto up today, the short answer is a mix of falling oil prices, a wave of short liquidations, and strong ETF demand.
The total crypto market cap rose about 3.67% to $2.9 trillion today, based on CoinMarketCap data. Bitcoin, Ethereum, XRP, and Solana are all posting sharp gains as buyers step back in.
Sentiment has flipped hard too. The Crypto Fear & Greed Index sits at 78 right now. That's Extreme Greed territory, and it says a lot about how traders feel this week.
So what's actually driving the move? Let's break it down with the latest Bitcoin news today and XRP's latest news.
Why Is the Crypto Market Up Today? Oil Prices Are the Big Reason
One of the main triggers behind today's rally is a drop in oil prices. Brent crude fell 2.80% to around $101 a barrel. That eased worries about inflation creeping back up.
The drop came after President Trump called off planned strikes on Houthi positions in Yemen at the last minute. The Pentagon had reportedly prepped for the operation after a request from the Saudi crown prince, but it got cancelled before it started.
Lower oil prices tend to calm broader markets. Crypto traders read that as a green light to add risk back into their portfolios.
Bitcoin FOMO Hits Its Highest Level Since 2024
Bitcoin's mood has flipped from caution into full celebration mode. Talk of BTC going "higher" has now outpaced bearish chatter by a wide margin, according to Santiment data, as $BTC pushed toward $87K.
A short squeeze helped push things along. Roughly $648 million in bearish crypto positions got liquidated in just 24 hours, and total trading volume jumped 39%. That kind of forced buying tends to speed price moves up fast.
But there's a catch worth watching. Open interest still climbed 7.6% to about $156 billion, even with all those shorts wiped out. That suggests traders are opening fresh leveraged bets instead of stepping back and taking profit.
Crypto markets often punish crowded one-way bets. Extreme fear tends to show up near bottoms, and everyone agreeing prices are "going higher" can sometimes show up near short-term tops too. That doesn't mean a reversal is coming, but it's a fair reason to stay a little careful right now.
Trading volume backs this up. Bitcoin and major altcoins just posted their strongest combined weekly volume since the first week of March, as more traders piled back into the market.
Crypto Fear and Greed Index Today: Extreme Greed at 78
The Crypto Fear & Greed Index reads Extreme Greed at 78 as of September 22, 2026. That's up from 70 yesterday, 69 last week, and 66 last month.
Timeframe | Fear & Greed Score | Sentiment |
Now | 78 | Extreme Greed |
Yesterday | 70 | Greed |
Last Week | 69 | Greed |
Last Month | 66 | Greed |
The steady climb shows bullish sentiment building over the past month, not just a one-day spike. That said, extreme greed readings have historically lined up with markets that get a little ahead of themselves.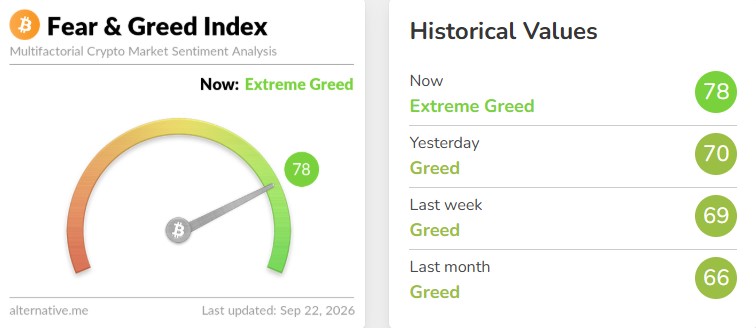
Bitcoin Liquidations Add Fuel to Today's Crypto Rally
Short sellers took a beating over the past 24 hours. The liquidation heatmap shows roughly $1.04 billion wiped out across 135,838 traders.
Bitcoin led the way with about $609.70 million in liquidations, followed by Ethereum at $182.67 million and Solana at $38.46 million.
Short positions made up the bulk of it too, at roughly $843.41 million, compared to $200.36 million in long liquidations. The single largest order was a $20.86 million BTC-USDT position wiped out on Hyperliquid.
When that many shorts get forced out at once, it tends to push prices up even faster, since traders have to buy back what they sold.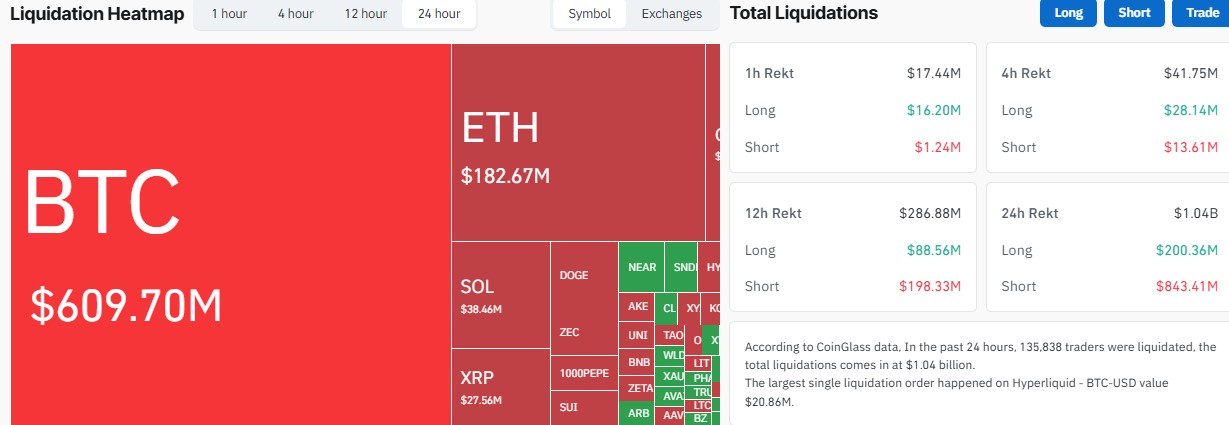
Bitcoin, Ethereum, and XRP ETF Flows Today
ETF flows have stayed strong across the board, and that's giving the rally more staying power. Here's the latest crypto news today on ETF inflows for all three coins.
Bitcoin (BTC): Spot Bitcoin ETFs pulled in $998.95 million in net inflows in a single day. Over 30 days, that's $2.45 billion, and cumulative net inflows now sit at $56.16 billion. Total ETF net assets are $110.14 billion, or 6.30% of Bitcoin's $1.71 trillion market cap. BlackRock's IBIT led with $381.37 million in daily inflows, and Fidelity's FBTC brought in $238.84 million.
Ethereum (ETH): Spot Ethereum ETFs saw $269.98 million in daily net inflows, with $1.37 billion over 30 days and $13.52 billion cumulatively.
Net assets stand at $17.82 billion, or 5.24% of Ethereum's $331.63 billion market cap. BlackRock's ETHA took in $110.06 million, Fidelity's FETH added $72.96 million, and Grayscale's ETH brought in $59.30 million.
XRP: XRP ETFs saw no net inflow on the latest day, though 30-day inflows reached $157.99 million and cumulative inflows total $1.71 billion. XRP ETFs now hold $1.62 billion in net assets, or 1.68% of XRP's $94.09 billion market cap.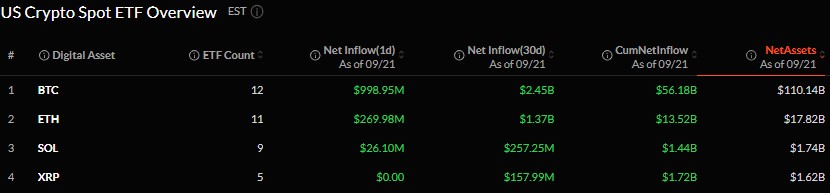
Bitcoin Price Prediction: What's Next After $85,000?
Looking at the weekly Bitcoin chart, the price has formed a strong recovery pattern after finding support near the $60,000 to $70,000 zone. BTC has reclaimed the $78,600 area and is now trading around $85,300.
If the upward move continues, the next resistance levels to watch sit around $92,100, then $100,200, and $111,700. A clean break above $92,100 could open the door toward the $100,000 to $111,700 range.
On the downside, $78,600 and $73,700 are the key support levels. Holding above these keeps the recovery intact. A break below could bring the $69,000 to $60,000 zone back into play.
These are technical scenarios, not guarantees. Treat them as levels to watch, not targets to bank on.
Ethereum Price Prediction: Is $3,000 Back in View?
Ethereum broke out of its bull flag pattern on Monday, September 21, after clearing the upper trendline. That breakout puts a potential upside target around $3,250, a level that acted as strong resistance back in January 2026.
TradingView flagged $2,672 as a key weekly pivot after ETH pushed above its 50-week average, with the next target zone at $2,950 to $3,000.
Analyst Ted Pillows said ETH could test $2,900 to $3,000 after closing above $2,550 on the weekly chart, though he also flagged a possible pullback after that move. He noted ETH could slip back to $2,400 if the weekly candle fails to hold above $2,550.
Analyst Ash Crypto pointed out, in the latest Ethereum news, that ETH gained 6.77% on the latest weekly candle and broke above a range it had been stuck in, placing $3,200 to $3,600 in view if the breakout holds.
None of these levels are locked in. Ethereum still needs to hold old resistance and absorb selling pressure on the way up.
XRP Price Today and XRP Price Prediction: Whales Are Buying, What's Next?
XRP price today is up sharply, rallying 8.22% in just three days, and whale wallets are a big part of the story. Recent XRP news today points to whales accumulating more than $2 billion worth of XRP, and that demand now appears to be showing up in price.
On-chain data suggests there may still be room to run. The URPD (URPD is a chart that shows how many coins were bought at each price) shows relatively light resistance ahead until $1.60, a level where roughly 2.50 billion XRP previously changed hands.
That $1.60 zone is worth watching for potential profit-taking before the next setup takes shape.
A confirmed break above $1.60 could open the door toward $2, based on the pattern's projected move of around 25%. Beyond that, some analysts have flagged $1.70 as a level worth watching too, though that depends on $1.50 becoming support first.
Bottom Line
Crypto is up today on a mix of cooling geopolitical risk, falling oil prices, a wave of short liquidations, and strong ETF demand. Sentiment has turned to Extreme Greed, which has historically been a signal to stay alert rather than a reason to panic.
Bitcoin, Ethereum, and XRP all show constructive charts, but every level mentioned here is a technical scenario, not a promise.
Disclaimer
This article is for informational purposes only and does not constitute financial, investment, or trading advice. Cryptocurrency markets are highly volatile and carry significant risk of loss. Price predictions and technical levels mentioned are scenarios based on chart analysis, not guarantees of future performance. Always do your own research and consult a licensed financial advisor before making investment decisions.
















