ZAMA Price Prediction 2026–2030: Can ZAMA Break Higher?


ZAMA price prediction chatter got loud and fast. The token trades near $0.0818, up 31.81% in 24 hours, as of 06:15 UTC on September 20, 2026.
The trend flipped after the post-launch price crash, with an ascending channel breakout now pointing up. Support sits near $0.0613, resistance near $0.0935.
Fresh catalyst: confidential vaults launched on September 15, 2026 (UTC).
But the next move hangs on levels. Not a generic forecast.
ZAMA Price Prediction October 2026
ZAMA price prediction for October 2026 starts with an overheated chart.
Price trades at $0.0818, and the Relative Strength Index (RSI), a 0 to 100 momentum gauge, reads 80.03 on the TradingView daily chart. Volume hit $261.87M.
Bias: cautious, with a pullback toward $0.0640 likelier than a straight run.
Near-term target: $0.0935, then $0.1226 only after a hold.
ZAMA Price Prediction Quick Forecast
ZAMA price prediction 2026 ranges start from the 06:15 UTC, September 20, 2026 snapshot.
Period | Bear Case | Base Case | Bull Case | Key Trigger |
24H | $0.0680–$0.0760 | $0.0760–$0.0880 | $0.0880–$0.0935 | Support/resistance |
3–7D | $0.0613–$0.0700 | $0.0700–$0.0935 | $0.0935–$0.1100 | Breakout/breakdown |
2–4W | $0.0516–$0.0640 | $0.0640–$0.0935 | $0.0935–$0.1226 | Volume + trend |
3M | $0.0446–$0.0600 | $0.0600–$0.1000 | $0.1000–$0.1226 | Adoption/unlocks |
6M | $0.0300–$0.0500 | $0.0500–$0.1100 | $0.1100–$0.1700 | Market cycle |
End 2026 | $0.0400–$0.0550 | $0.0550–$0.1050 | $0.1050–$0.1693 | Tokenomics + market |
2027 | $0.0250–$0.0500 | $0.0500–$0.1200 | $0.1200–$0.2176 | Ecosystem growth |
ZAMA Current Price and Market Snapshot
ZAMA 24H Price, Volume and Market Cap
Breaking: ZAMA price today jumps 31.81% in 24 hours to $0.08177, per CoinMarketCap data.
Market cap: $204.39M, up 29.89%.
24H range: $0.06133 to $0.09076. That's a 48% swing.
Volume: $261.87M, up 147.6%.
Circulating supply: 2.49B of 11.3B ZAMA. Fully diluted valuation (FDV), the market cap if every token were traded: $924.4M.
Turns out, the next supply change is the October 2, 2026 (UTC) unlock.
ZAMA Technical Analysis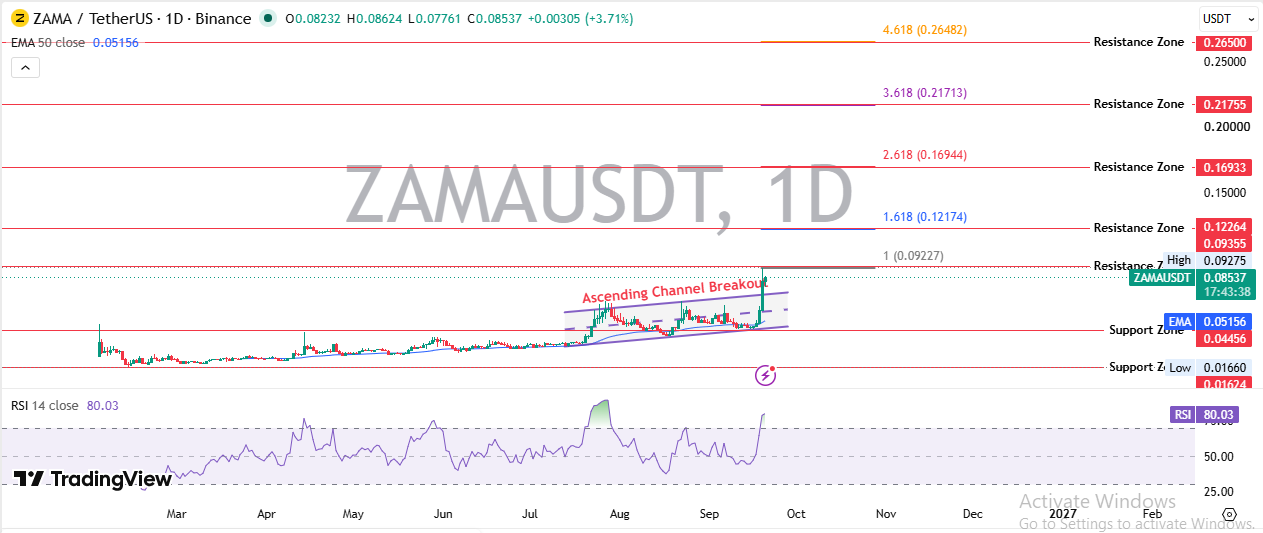
ZAMA Support Levels
ZAMA support levels start at $0.0613 to $0.0640, roughly the old channel top and the 24H low.
Broken resistance often flips into support. Fail here, and the earlier ZAMA sell-off analysis matters again.
Next: the 50-day average at $0.0516, then the $0.0446 base floor.
ZAMA Resistance Levels
ZAMA resistance levels begin at $0.0908 to $0.0935, the 24H high and the chart's ceiling.
Confirmation needs sustained trading above $0.0935 on rising volume. One wick doesn't count.
Beyond it, Fibonacci extension targets (projections from a prior swing) sit at $0.1226, $0.1693, $0.2176 and $0.2650. And each step needs fresh buyers.
ZAMA RSI and Momentum
When we pulled up the $ZAMA RSI, the first thing that stood out was how vertical it climbed to 80.03.
Momentum seems unstoppable. Actually, scratch that: RSI above 70 flags overheated buying.
MACD, a trend-momentum tool, reads 0.00499 over a 0.00139 signal line. Bullish, for now.
But cooling is the likelier price implication. Confirmation needs RSI near 60 with price holding above $0.0640.
So can momentum this hot survive a week of profit-taking?
$ZAMA Moving Averages
$ZAMA moving averages carry little weight yet, since the token just left its base.
Only the 50-day exponential moving average (EMA), a trend line weighting recent prices, adds information at $0.0516.
Turns out, price trades about 59% above it. That gap is the loudest warning on the chart.
$ZAMA Volume Analysis
$ZAMA volume confirms the move on paper: $261.87M, up 147.6%.
But CoinGlass futures data tells another story. Futures volume hit $522.48M against $139.74M in spot.
Binance's account long/short ratio reads 2.2404, so longs crowd that venue.
Basically, a derivatives-led rally is fragile. Liquidations (forced exits) stayed light at $1.69M.
$ZAMA Breakout or Breakdown Levels
Bullish Breakout Scenario
A $ZAMA breakout needs sustained trading above $0.0935.
Volume must hold near $260M a day. Next target: $0.1226, about 50% above spot.
Invalidation sits below $0.0640. Because when a channel breakout gives back its gains, it usually turns into a bull trap.
Bearish Breakdown Scenario
A $ZAMA breakdown starts when $0.0613 fails on rising volume.
Targets: $0.0516, then $0.0446, the zone in the $0.05 reclaim analysis.
We've seen this pattern before: a vertical candle, then a full retest. Invalidation is trading back above $0.0935.
$ZAMA Token Unlocks and Supply Pressure
Total supply stands at 11.3B ZAMA, with 2.49B circulating, about 22%. CoinMarketCap's unlocked market cap of $229.36M implies roughly 2.80B unlocked.
A third-party tracker lists a $ZAMA token unlock of about 114.6M ZAMA on October 2, 2026 (UTC). That's 1.01% of total supply, or 4.6% of circulating. The tracker doesn't name the recipient.
Etherscan holder data shows one address holding about 67.8% of supply.
Zama's documentation says the protocol burns fees and mints rewards on an emission schedule. Max supply is uncapped.
Here's the thing: 114.6M tokens is about $9.4M, roughly 3.6% of daily volume. Manageable.
The coin events calendar helps confirm timing.
$ZAMA Fundamentals and Catalysts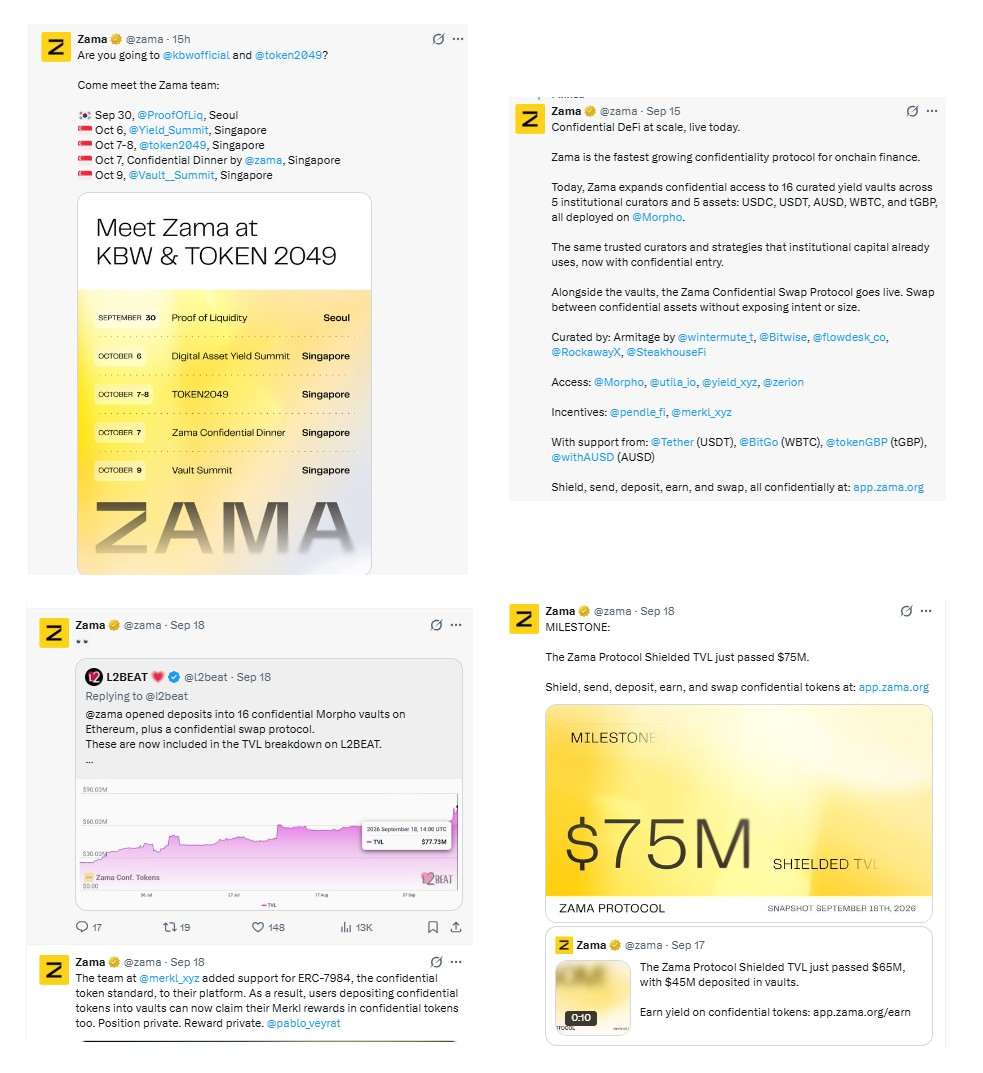
Zama FHE Adoption
Fully homomorphic encryption (FHE) lets networks process data while it stays encrypted. Zama's protocol works as an FHE confidentiality layer for public blockchains, per an official Zama post.
Shielded total value locked (TVL) passed $75M on September 18, 2026 (UTC).
Confidential DeFi Growth
On September 15, 2026 (UTC), Zama opened 16 curated yield vaults on Morpho, plus a confidential swap protocol.
L2BEAT logged TVL at $77.75M on September 18, 2026, 14:00 UTC. And Merkl added ERC-7984 support, so rewards stay private too.
Incentives from Pendle and Merkl work like crypto airdrop campaigns for attracting users.
Institutional Adoption
Turns out, real deployments exist. Bitwise, Flowdesk, RockawayX and Steakhouse Financial curate vaults, with assets tied to Tether, BitGo and AUSD.
Zama's team appears at TOKEN2049 in Singapore on October 7 to 8, 2026 (UTC).
Competition and Regulation
Rival privacy tools, including zero-knowledge proofs, chase the same demand.
Regulation stays unclear, adoption could trail TVL, and liquidity is thin at 1.16% of market cap.
$ZAMA Bull Case, Base Case, and Bear Case
No odds attached, since no defensible model exists.
Scenario | Price Range | Conditions | Invalidation |
Bear | $0.0446–$0.0640 | Support failure + weak BTC | Reclaim of $0.0935 |
Base | $0.0640–$0.0935 | Range-bound accumulation | Sustained breakdown |
Bull | $0.0935–$0.1226 | Resistance breakout + volume | Failed breakout |
ZAMA Price Prediction 2027–2030
Two assumptions drive every row: market cap and circulating supply (3.5B, 4.5B, 5.5B, and 6.5B $ZAMA), not an official schedule.
Year | Bear Case | Base Case | Bull Case | Main Driver |
2027 | $0.030 ($105M) | $0.120 ($420M) | $0.217 ($760M) | Adoption/liquidity |
2028 | $0.035 ($158M) | $0.150 ($675M) | $0.300 ($1.35B) | Ecosystem growth |
2029 | $0.040 ($220M) | $0.180 ($990M) | $0.400 ($2.2B) | Network usage |
2030 | $0.050 ($325M) | $0.220 ($1.43B) | $0.600 ($3.9B) | FHE adoption |
Privacy for AI data adds a wildcard, one that AI crypto news increasingly covers.
What Could Push $ZAMA Higher?
FHE adoption and developer adoption top the list. Each new confidential app adds fee demand.
Confidential DeFi and institutional usage follow. Burned fees shrink supply, so more usage means tighter float. And token demand grows if staking rewards attract holders.
Broader crypto strength helps too. Watching upcoming exchange listings matters for liquidity.
What Could Push $ZAMA Lower?
Token unlocks lead the risk list. Thin liquidity means small sells become big candles. And a failed breakout above $0.0935 would trap late buyers.
BTC weakness, regulation, slower adoption, and rival privacy tools all cap upside. Speculation in meme coin market news can drain attention.
Noted.
$ZAMA Trader Takeaway
Condition | Reading |
Above $0.0935 with rising volume | Bullish confirmation |
Between $0.0640 and $0.0935 | Range condition |
Below $0.0613 | Bearish confirmation |
Rising volume | Confirms direction |
Falling volume | Caution |
October 2, 2026 (UTC) unlock | Supply-risk checkpoint |
That's a checklist, not a trade call. Other setups sit in more crypto price predictions.
Exactly.
Disclaimer: This article is for information only and isn't financial advice. Crypto prices are volatile, and forecasts can fail.


















