ZetaChain Price Prediction 2026-2030: What Traders Should Watch?


ZETA trades near $0.065, up more than 65% in a day.
A ZetaChain price prediction needs context, not history. The token just broke a descending channel on strong volume. RSI sits near 88, deep overbought.
This move traces to one announcement, a proposed Solana migration.
ZetaChain Price Prediction: September 2026 Snapshot
As of 14:30 UTC, September 21, 2026, ZETA trades around $0.065, per CoinMarketCap's live data.
Metric | Value |
Price | ~$0.0650 |
24H Change | +65% to +67% |
Market Cap | ~$104.5M |
24H Volume | ~$35.5M |
Circulating Supply | 1.6B |
Total Supply | 2.1B |
RSI (14) | 87.99 (Overbought) |
Trend | Bullish breakout |
Support 1 | $0.0394 |
Support 2 | $0.0268 |
Resistance | $0.0696 |
ZETA Price Trend and Market Structure
For months, ZETA carved lower highs in a falling channel. That structure just snapped.
The breakout candle on the daily ZETA chart cleared resistance on real volume. Trading sits above the 100-day EMA near $0.0365. Bitcoin stayed flat. This rally is ZETA-specific.
ZetaChain Price Catalysts
ZetaChain Adoption and Ecosystem Growth
The dominant story is the proposed Solana migration: shutting down its Cosmos Layer 1 and converting ZETA into a native Solana SPL token.
AI and Anuma Developments
Anuma, ZetaChain's private AI app, reportedly counts over 300,000 users. Independent trackers call this the real driver, and AI-sector coverage picked it up fast.
Token Supply and Unlocks
Circulating supply sits at 1.6B of 2.1B max. Remaining unlocks pressure price unless demand keeps pace.
Bitcoin and Broader Market Conditions
Bitcoin stayed range-bound while ZETA surged, a rare decoupling with no market-wide safety net.
ZetaChain Price Risks
Supply dilution stays a constant drag, and unlocks could land at inconvenient moments.
Support failure at $0.0394 is the line in the sand. Competition and migration security questions sit on the risk side too. Adoption not meeting expectations is, frankly, the biggest one. The wider altcoin news cycle is full of announcements that never held.
ZetaChain Technical Analysis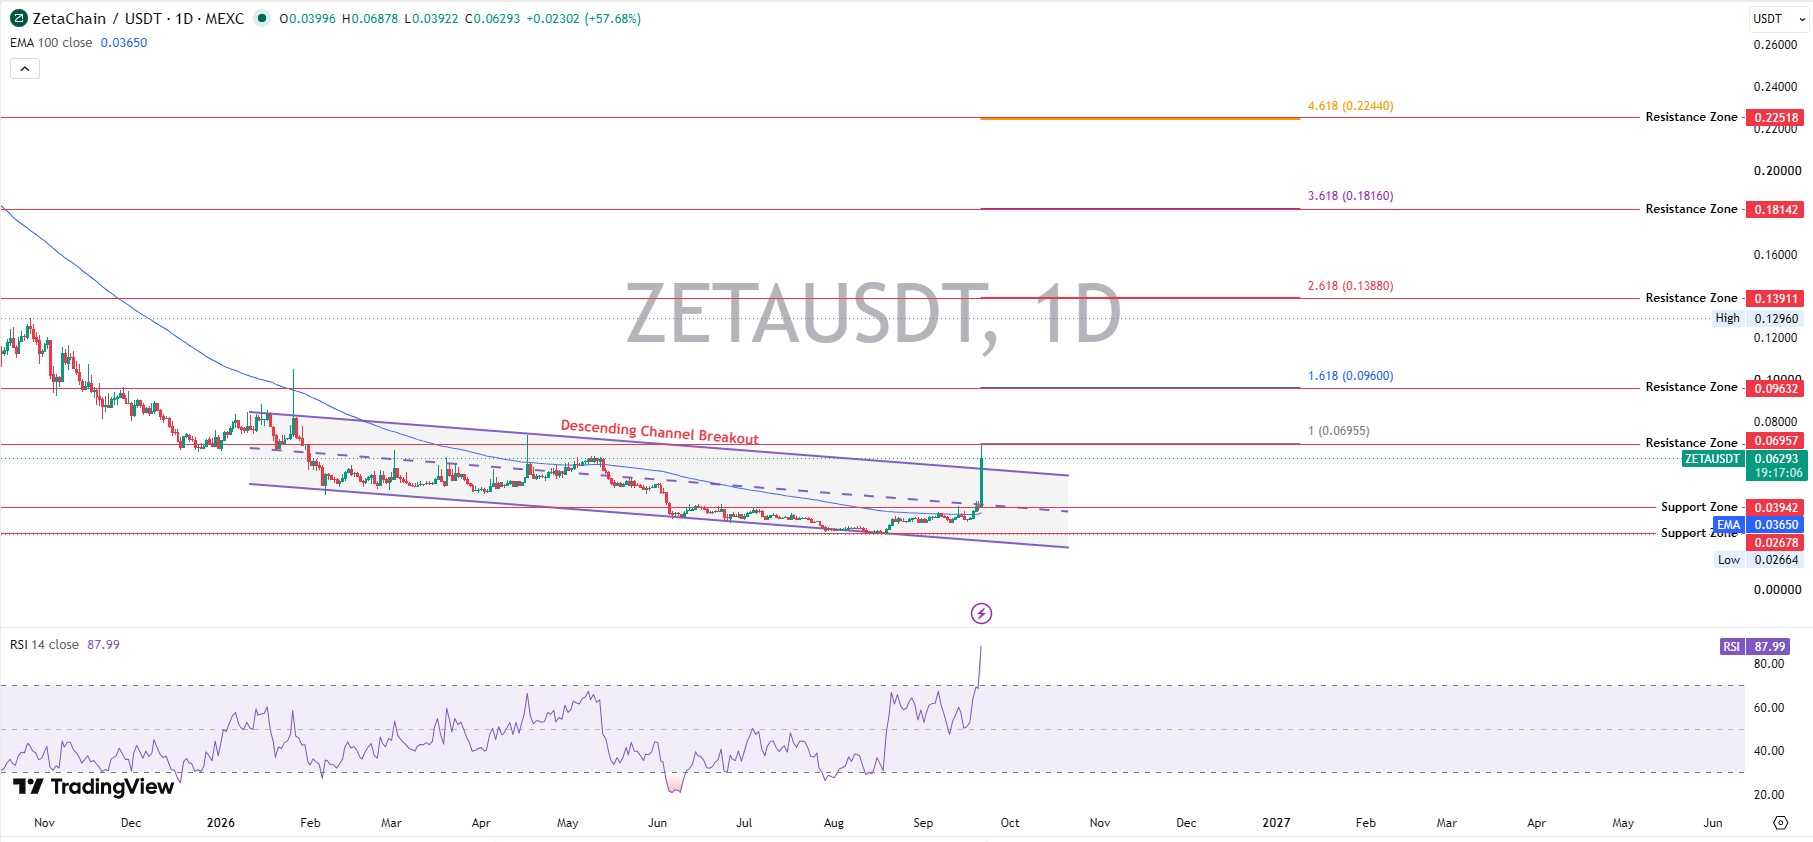
ZETA Support Levels
Immediate support: $0.0394, then $0.0268, then the all-time low of $0.02665 from mid-August.
ZETA Resistance Levels
First resistance: $0.0696, then Fibonacci zones at $0.0963, $0.1391, $0.1814, and $0.2252.
ZETA RSI and Momentum
Daily RSI reads 87.99, deeply overbought. That does not guarantee reversal, but it lines up with the migration announcement.
ZETA MACD and Moving Averages
MACD stays positive, line above signal. Trading sits above the 100-day EMA near $0.0365.
ZETA Volume Analysis
Volume jumped over 400% during the breakout, a sign of real capital rotation, not thin trading.
ZETA Price Prediction for the Next 24 Hours
Momentum favors continuation, but the setup is stretched. RSI near 88 rarely holds forever. Direction hinges on whether volume stays elevated.
Bullish Breakout Scenario
Trigger: a close above $0.0696. Confirmation: MACD above signal. Target: $0.0963. Requirement: sustained volume across exchange trading pairs.
Bearish Breakdown Scenario
Failed support: a close below $0.0394. Downside zone: a retest of the $0.0365 EMA. That loss unwinds the thesis.
ZetaChain Price Prediction for the Next 7 Days
Base range: $0.045-$0.065.
Upside: toward $0.0963 if volume holds.
Downside: back to $0.0268 if the rally fails.
Watch upcoming project catalysts; the migration vote resolves inside this window.
ZetaChain Price Prediction for October 2026
Structure pairs a fresh breakout with overbought RSI, an uneasy combination.
Range: $0.045-$0.10.
Bullish: the vote passes, adoption holds.
Bearish: profit-taking breaks EMA support.
ZetaChain Price Prediction 2026
Scenario | 2026 Target Range | Key Assumption | Invalidation |
Bear | $0.02 - $0.04 | Weak market, support failure | Recovery above $0.05 |
Base | $0.05 - $0.10 | Stabilization, moderate demand | Loss of $0.0394 support |
Bull | $0.10 - $0.22 | Breakout holds, adoption grows | Failed breakout, rejection |
On-chain holder data shows roughly 97,000 holders, though top-wallet concentration stays high.
ZetaChain Price Prediction 2027-2030
Beyond 2026, single numbers stop making sense. Market-cap math works better: target price equals market cap divided by circulating supply, which keeps climbing toward the 2.1B cap.
ZETA Price Prediction 2027
The base case is a $300M market cap, which works out to about $0.16 a token. The bull case is $600M, or about $0.32.
If you divide $300M by $0.16, you get roughly 1.875B tokens in circulation. That's about 225M short of the 2.1B maximum, so more tokens are still coming.
The bull case is just the base case doubled. Supply stays the same, so the price doubles with the cap. The math is easy, but the assumption isn't: the market would have to value the network at twice as much within a year.
Keep an eye on the unlock schedule. Every token released beyond 1.875B waters down the price unless the market cap grows enough to cover it.
ZETA Price Prediction 2028
The range is an $800M to $1.2B cap, or about $0.38 to $0.57 a token.
By now the model assumes all 2.1B tokens are out. Supply stops changing, so the price only moves if the market cap moves. That's why the original text says adoption matters more than technicals. A chart pattern can't add value to the network.
It's a big jump from 2027, too. Even the low end of $800M is almost 2.7 times the 2027 base cap. To see what "stalled adoption" looks like, imagine the cap stays at $300M. Spread across 2.1B tokens, that's about $0.143, which is lower than the 2027 base price. Nothing went wrong in that scenario except that more tokens showed up.
ZETA Price Prediction 2029
Bear is about $0.19, base is about $0.48, and bull is about $0.95.
The source only gave prices, so I multiplied each by 2.1B to get the caps: roughly $400M, $1.0B and $2.0B.
The bear case is only a third higher than the 2027 base cap, so it describes a network that never really takes off. The base case of $1.0B sits inside the 2028 range, which means 2029 is treated as a year of holding steady rather than another climb. Bull is five times bear, so the outcome depends heavily on whether adoption happens.
ZETA Price Prediction 2030
Bear is under $0.20, base is $0.50 to $0.80, and bull is above $1.20.
At 2.1B tokens, that means:
Scenario | Price | Market cap |
Bear | under $0.20 | under ~$420M |
Base | $0.50 to $0.80 | ~$1.05B to $1.68B |
Bull | above $1.20 | above ~$2.5B |
The bear case is almost the same as 2029's, so the model treats a failed network as flat rather than still falling. The base case needs steady growth in the cap, and the bull case needs it to grow to nearly double the middle of the base range. The gap between bear and bull is 6x or more, and that's why one exact number for 2030 would be dishonest.
Summary table
Year | Scenario | Market cap | Supply | Price | Cap vs. 2027 base |
2027 | Base | $300M | ~1.875B | ~$0.16 | 1x |
2027 | Bull | $600M | ~1.875B | ~$0.32 | 2x |
2028 | Low end | $800M | 2.1B | ~$0.38 | 2.7x |
2028 | High end | $1.2B | 2.1B | ~$0.57 | 4x |
2029 | Bear | ~$400M | 2.1B | ~$0.19 | 1.3x |
2029 | Base | ~$1.0B | 2.1B | ~$0.48 | 3.3x |
2029 | Bull | ~$2.0B | 2.1B | ~$0.95 | 6.7x |
2030 | Bear | under ~$420M | 2.1B | under $0.20 | 1.4x |
2030 | Base | ~$1.05B to $1.68B | 2.1B | $0.50 to $0.80 | 3.5x to 5.6x |
2030 | Bull | above ~$2.5B | 2.1B | above $1.20 | 8.4x+ |
What Could Invalidate the ZETA Price Forecast?
A loss of $0.0394 undoes the bullish case. A failed breakout above $0.0696 with hard rejection would too. Declining volume is an early warning sign.
Unexpected unlock pressure can hit without notice; the token unlock and airdrop tracker sometimes catches it early. Worsening Bitcoin structure or an Anuma letdown would weaken the case.
What Traders Should Watch?
ZETA traders should keep an eye on $0.0696 resistance, $0.0394 support, RSI near 88, and trading volume. The Solana migration, Anuma user growth, and token unlocks could also shape the next move. A break above resistance needs strong volume, while losing support could trigger a pullback.
ZetaChain Trader Takeaway
The level that matters now is $0.0394. Lose it, and the breakout story falls apart.
Strength shows as a clean push through $0.0696 with volume holding. Weakness shows as a close under the $0.0365 EMA. The migration vote is the catalyst that could shift everything within days.
What happens if the vote passes but adoption disappoints?
That's why overbought RSI deserves caution, not blind confidence. Traders should track volume, the vote result, and Anuma's user growth. That's the setup.
Disclaimer
This article is for informational purposes only and does not constitute financial, investment, or trading advice. Cryptocurrency markets are highly volatile, and prices can change rapidly. Any figures, targets, or scenarios mentioned reflect analysis of available data at the time of writing and should not be treated as guarantees of future performance. Independent research and professional financial consultation are recommended before making any investment decisions.


















