NEAR Protocol Price Prediction: Can the 90% Weekly Rally Continue?


NEAR has gone from a slow grind to a hard sprint, and the question now is whether buyers still have fuel.
This NEAR Protocol price prediction weighs how strong the run really is and what could extend or cool it. Moves this fast rarely stay quiet for long.
What Is the NEAR Protocol Price Today After a 25% Surge?
According to Coinglass, NEAR trades near $4.37, up over 25% in 24 hours and 90.53% across seven days.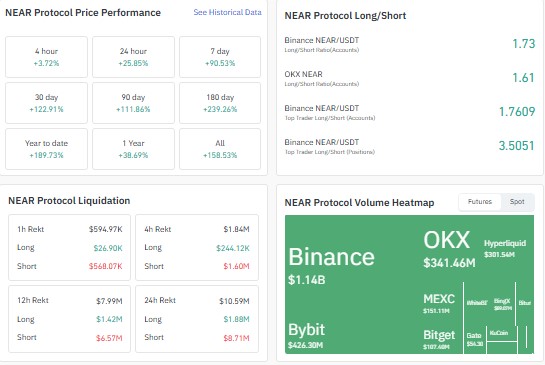
The 30-day gain stands at 122.91%, against a one-year return of just 38.69%, so much of the advance is recent.
The NEAR market cap sits at $5.72 billion against a circulating supply of 1.30 billion tokens.
NEAR trading volume leans heavily on derivatives, with $2.89 billion in futures against $717.99 million in spot, roughly four to one.
What Does $NEAR Liquidation Data Say About Traders?
Positioning leans long. Per Coinglass, the Binance account long-short ratio is 1.73, OKX reads 1.61, and top traders on Binance carry 3.5051 by positions.
The pain, though, landed on the other side. Of $10.59 million in crypto liquidations over 24 hours, shorts made up $8.71 million and longs $1.88 million.
Short covering likely added fuel to the climb, but a crowded long book now leaves the token exposed if momentum fades.
Is NEAR Protocol Open Interest Signalling Fresh Leverage?
NEAR Protocol open interest has climbed to $1.29 billion on Coinglass, well above the roughly $850 million peak from late May and about double the $600 million area from early September.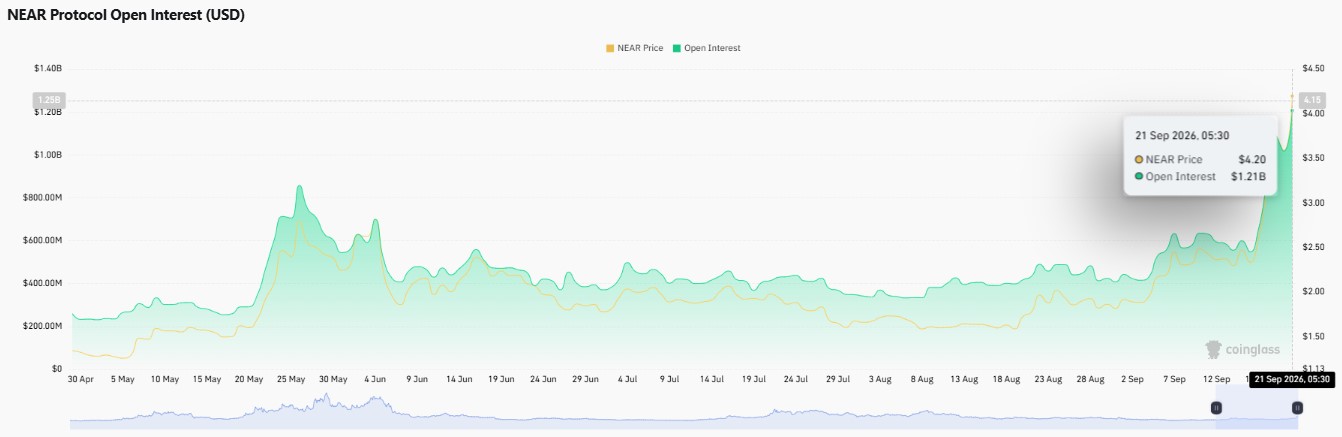
Rising open interest beside a rising price usually means new positions are entering, which supports the trend for now.
The catch is leverage, since a stretched market can turn sharply if longs unwind together.
What Is Driving NEAR Protocol Adoption Right Now?
An X post by BSCN, relaying the project's own announcement, says Near Intents hit a record daily volume above $300 million on September 18.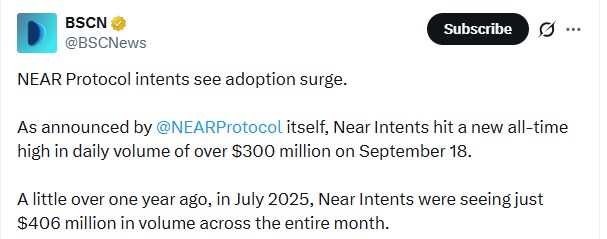
The same post notes that all of July 2025 produced only $406 million in volume. That kind of growth across the NEAR ecosystem gives the rally a story beyond leverage, though one record day does not confirm lasting demand.
NEAR Protocol Technical Analysis: Is the 4H Bull Flag Still Valid?
Per TradingView chart data for NEAR/USDC on Coinbase, the price spent the first half of September grinding between roughly 2.28 and 2.82 before a vertical push lifted it toward 3.95.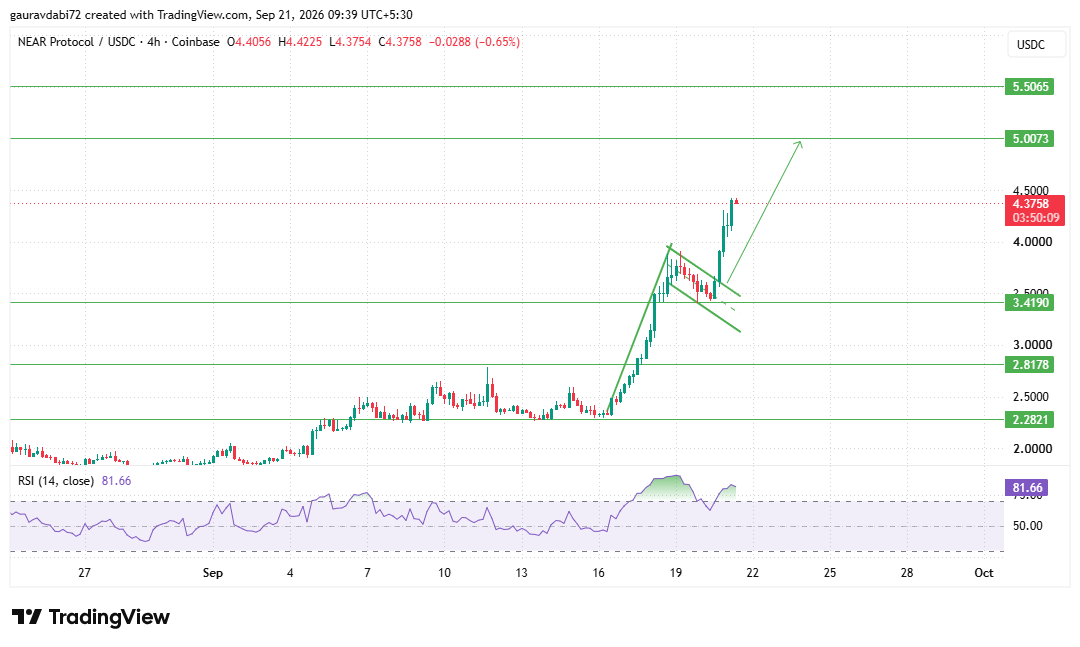
A shallow, downward-sloping pause into the 3.41 zone followed, forming a bull flag pattern, and buyers then cleared its upper edge with a run past 4.40.
The 14-period RSI at 81.66 sits deep in overbought territory, so a cooling phase would not be surprising.
What Are the Key Support and Resistance Levels for NEAR?
The first of the NEAR Protocol key support levels is 3.4190, the flag base where buyers defended the pullback.
Losing it would bring 2.8178, the old range high, into play, with 2.2821 acting as the launch floor of the whole advance.
On the upside, 5.0073 and then 5.5065 are the resistance levels to watch, and a move beyond them needs buyers to keep absorbing profit-taking.
Will NEAR Protocol Price Go Up From Here?
The NEAR Protocol price prediction stays tied to the flag base. Holding it keeps the bullish structure intact, while an RSI reset can happen without damaging the trend.
Scenario | Trigger | Key Levels |
Bullish | Buyers keep absorbing dips above the flag base. | 5.0073, then 5.5065 |
Neutral | Price cools sideways while RSI resets. | Holds above 3.4190 |
Bearish | Overextended longs unwind, and the price closes below the flag base. | 3.4190, then 2.8178 and 2.2821 |
What Risks Could Cool This Rally?
Stretch is the main threat. A 90% weekly gain with RSI above 80 leaves little room for error, and futures volume running about four times spot suggests leverage is steering much of the move.
With long-skewed ratios and $1.29 billion in open interest, a slide through the flag base could set off a chain of long liquidations.
How Does the Analyst Desk Read the NEAR Protocol Setup?
As per the CoinGabbar analyst desk, the setup rewards patience more than chasing.
Rising Near Intents volume and an orderly flag give the advance real support, yet an RSI above 80 hints that some of the easier gains may already be booked.
A hold above 3.4190 would suggest buyers remain in control, while a slip below it would point to a deeper reset before another attempt at 5.0073.
Final Outlook: Can the Momentum Last?
The NEAR Protocol price prediction stays constructive while price holds above the flag base, with 5.0073 and 5.5065 as the next resistance zones and record Near Intents activity as a supportive backdrop.
Overbought momentum and heavy leverage make volatility likely.
Disclaimer: This article is for informational purposes only and is not financial, investment, or trading advice. Crypto prices are highly volatile, so readers should assess their own risk before making any decision.


















