Avalanche Price Prediction October 2026: AVAX RWA News, $55.711 Ahead?

Avalanche price prediction October 2026 is the search that matters this week, because a long-awaited test is playing out on the weekly chart right now.
The levels are clear, the stakes are big, and the candle is still open. Read this before it closes.
Our editorial desk holds no personal position in AVAX. This is a chart and data read, nothing more.
Avalanche Price Today: AVAX Live Price, Volume, and Market Cap Data
The token trades near $11.147, up 0.66% on the day, per CoinGlass. Market cap is $4.92B. Futures volume over 24 hours reached $765.09M against $140.86M in spot volume, so derivatives flow runs about 5.4 times spot.
Open interest, the total value of futures contracts still open, stands at $613.30M. Circulating supply is 443.11M out of a 715.74M maximum, so about 61.9% is already out.
Every level below uses the chart CMP (current market price) of $11.135, not this snapshot.
Source: CoinGlass, October 1, 2026
Avalanche News Today: AVAX Tokenized Stock Inflows Hit $131.2M
Real-world assets are driving the story. 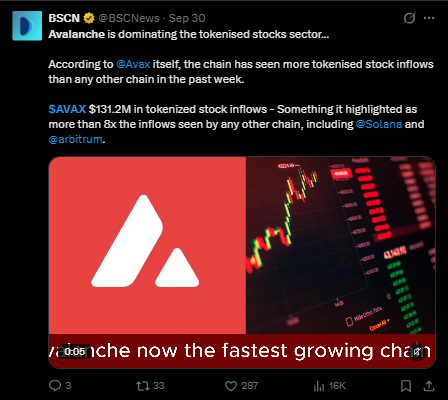
BSCN (@BSCNews) reported on September 30 that, by the chain's own figures, it took in $131.2M of tokenized stock inflows over the past week.
The chain described that as more than 8 times the inflows of any other network, Solana and Arbitrum included.
These are self-reported numbers, so treat the comparison as the chain's claim and not an independent ranking. Still, steady inflows show that traders are actually using the network. Our tokenized stocks explained guide breaks down how the product works.
Source: BSCN (@BSCNews) on X, September 30, 2026
Avalanche Price Prediction Technical Analysis: AVAX Price Forecast
Methodology: 1-week timeframe, Bybit perpetual contract, the oscillator panel on the chart, and invalidation set at a 1-week close below $5.715.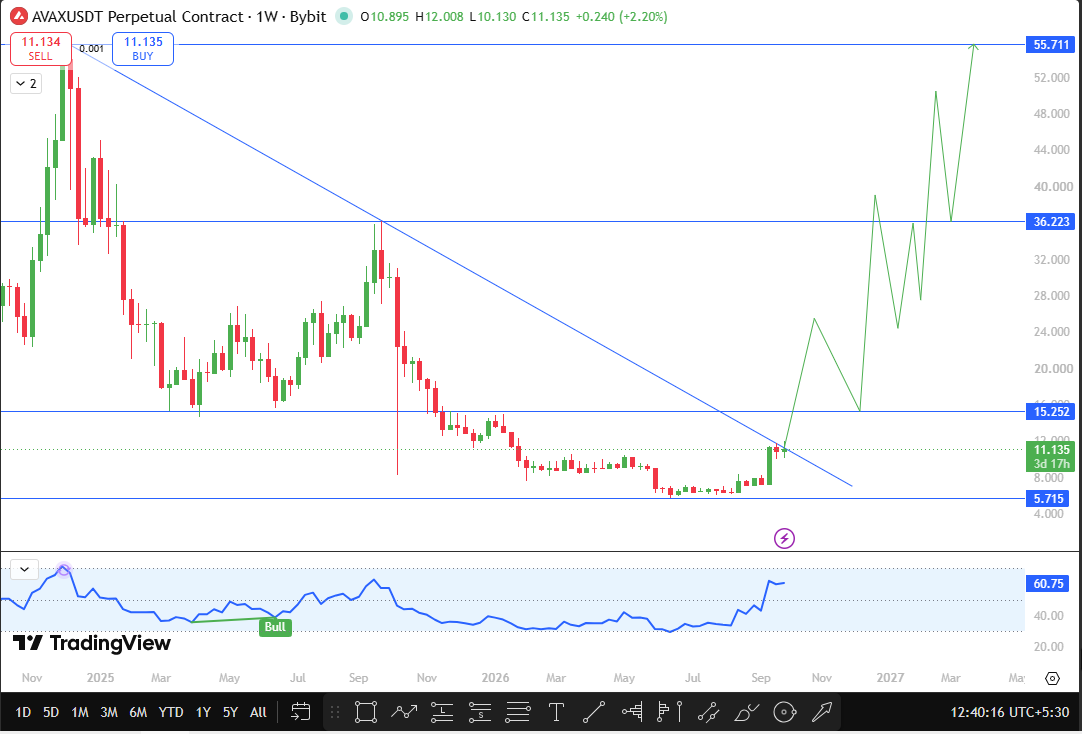
After the late-2024 peak near $55.711, the price slid for most of a year and a half. A descending trendline runs from that high through the September 2025 swing high at $36.223, and the price now sits right under it.
This week's high of $12.008 tested the line, and the weekly candle is up 2.20% with 3 days and 17 hours left. Nothing is confirmed until it closes.
A 1-week close above $15.252 would carry price over both the trendline and that resistance.
That opens $36.223, about 225.31% above CMP, then $55.711, about 400.32% above. The projected path on the chart is a staircase, with pullbacks that retest $15.252 and $36.223 as support.
A weekly chart trading guide explains why these closes matter more than any intraday spike.
The failure case is far away. A rejection at the trendline would not void the setup on its own. Only a 1-week close below $5.715, about 48.67% below CMP, does that. That level marks the base of the 2026 bounce, so losing it would erase the whole recovery. Our crypto breakout trading guide covers how to handle false breakouts.
The oscillator reads 60.75, firm and climbing off its lows. The only divergence label on the chart is a "Bull" tag from early 2025, and no bearish label shows now. Momentum is supportive, though a reading in this zone also means much of the bounce is already in the price.
Source: TradingView, AVAXUSDT Perpetual 1W, Bybit, October 1, 2026, 12:40 PM IST
AVAX Support and Resistance Levels: Key Avalanche Price Targets
Level | Role | Distance from CMP |
$55.711 | Major resistance | +400.32% |
$36.223 | Next resistance | +225.31% |
$15.252 | Breakout trigger | +36.97% |
$11.135 | CMP | 0.00% |
$5.715 | Setup invalidation | -48.67% |
Avalanche Price Outlook: AVAX Bull, Base, and Bear Scenarios Today
Bull case: A 1-week candle closes above $15.252. The trendline is then behind price, and $36.223 is the first target, another 137.5% above the trigger.
A hold above $15.252 on the first pullback would make the move far more convincing. After $36.223, the next stop is $55.711, a further 53.80%. Our AVAX staking rewards guide shows who tends to hold through moves like this.
Base case: Price keeps getting rejected near the trendline and ranges between $5.715 and $15.252 for weeks. That band is wide, so expect noise and slow progress. Patience is the cost, but the structure stays intact.
Bear case: A 1-week close below $5.715 voids the setup and returns price to the 2026 lows. At that point the breakout idea is off the table.
Avalanche Price Risks: What Could Stop the AVAX Weekly Breakout
The weekly candle is still open, so today's gain can disappear before the close. Futures volume dwarfs spot volume, so liquidations can cause sharp wicks.
A news-led pop can fade if the tokenized stock inflows slow down, and those figures are self-reported. Price has been pinned under this trendline for a long time, so a rejection here would not be surprising.
This is a weekly read, which means moves play out over weeks, not hours.
Trading Terms Glossary: Breakout, Trendline, and Divergence Explained
Breakout: price closing beyond a key level, such as a trendline or resistance.
Trendline: a line connecting swing highs or lows to show the direction of the trend.
Divergence: price and the oscillator moving in different directions, often hinting that momentum is changing.
Disclaimer
This article is for information and education only and is not financial advice. Crypto is volatile, and you can lose money. Do your own research and speak with a licensed advisor before investing.













.webp)








