TRON Price Prediction October 2026: TRX Outlook and Key Levels


The Tron Price Prediction October 2026 outlook starts with a quiet day. TRX is flat, yet it holds eighth place by market value and trades more than 20% below its December 2024 all-time high.
Tron launched its mainnet in 2018 and has become one of the most used networks for USDT stablecoin transfers.
The Tron price today is $0.3373, unchanged over 24 hours. The tron coin ranks 8th by market value, with a market cap of $32.037 billion.
Live TRX Market Data
Metric | Value |
Price | $0.3373 |
24h Change | 0.0% |
24h Range | $0.3371 to $0.3407 |
Market Cap | $32.037B |
Source: market data taken from CoinGecko, as of Oct 1, 2026. Figures may vary slightly across other tracking websites.
Tron Technical Analysis: Weekly Symmetrical Triangle Near the Apex
In the weekly chart, TRX is moving inside a large symmetrical triangle that began forming after the December 2024 high.
A falling trendline from that peak caps rallies, while a rising trendline from the late 2024 low holds dips.
Price is now squeezed close to the point where the two lines meet, which the chart places around late 2026.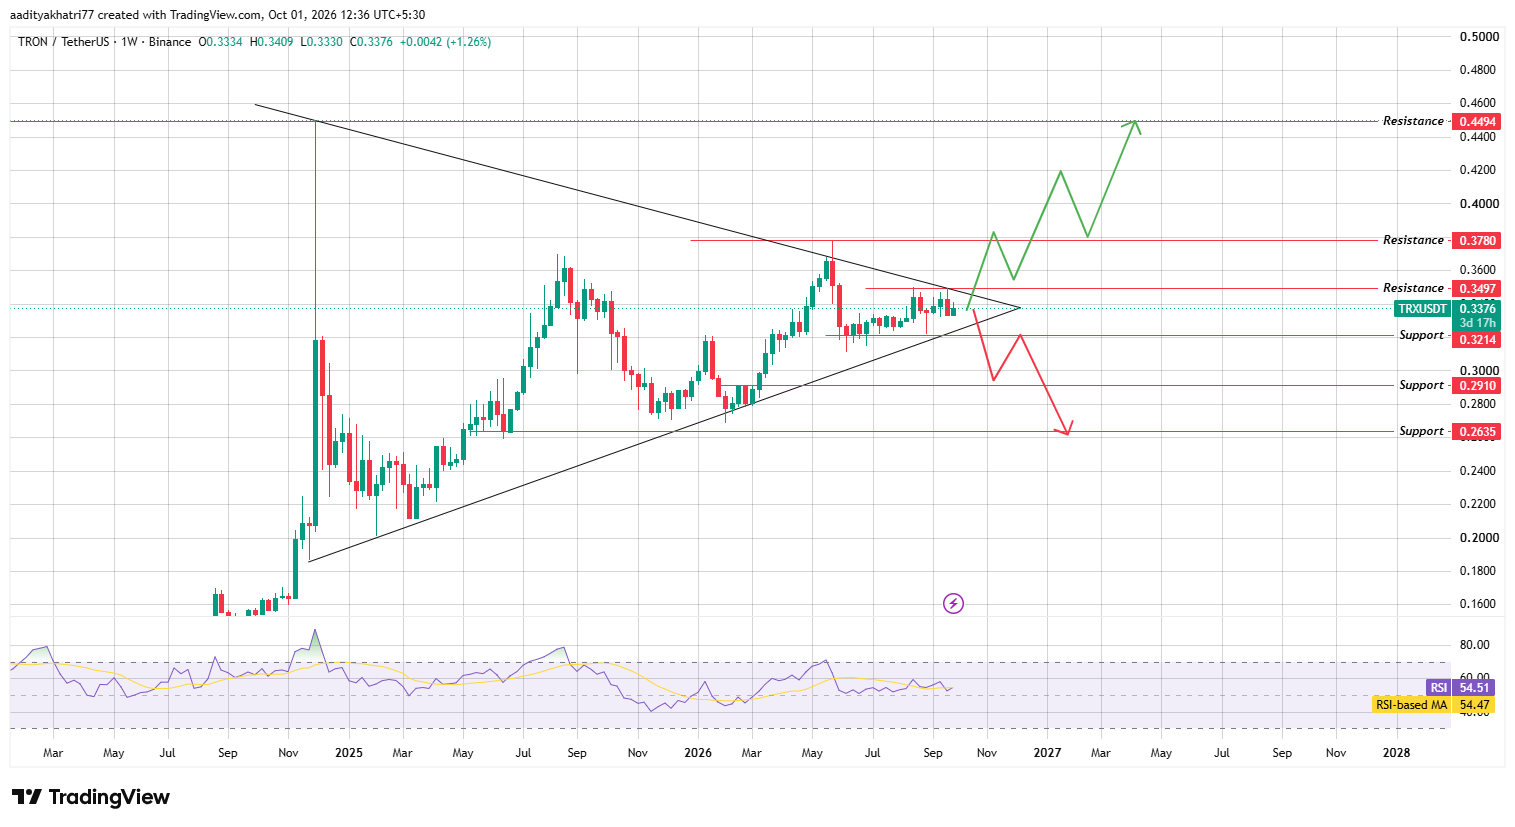
Source: Chart taken from TradingView, Binance TRXUSDT 1W chart, captured at 12:36 PM IST (UTC+5:30), October 1, 2026
That timing matters. Breakouts this close to the apex can fail, so confirmation carries extra weight.
The current weekly candle opened at 0.3334 and trades at 0.3376, so it is green. It closes on Monday, October 5, at 5:30 AM IST (00:00 UTC), and every level here refers to weekly closes.
RSI reads 54.51 and sits almost exactly on its moving average of 54.47. Momentum is neutral, and neither buyers nor sellers hold a clear edge.
The triangle also shows how both sides have been tested. The spike to about 0.383 in May 2026 was rejected at the falling trendline.
The dip toward 0.27 in early 2026, held at the rising trendline. Each line has therefore worked as a real boundary, which is why a break of either one would carry meaning.
Can TRX Break the Falling Trendline?
Buyers need a weekly close above the falling trendline, backed by volume higher than the average of the previous 20 weekly candles.
The nearest resistance is $0.3497, about 3.6% above the current price and close to that trendline.
A weekly close above both would end the squeeze in favor of buyers.
The next target is $0.3780, roughly 12.0% higher and near the May 2026 high. Beyond it sits 0.4494, about 33.1% above the current price, which matches the December 2024 peak.
The green path expects pullbacks to retest broken resistance after each leg.
What Happens If TRX Breaks the Rising Trendline?
Sellers need a weekly close below the rising trendline and the $0.3214 support, about 4.8% under the current price.
That would turn the triangle into a bearish breakdown.
The chart then points to $0.2910, about 13.8% lower, followed by 0.2635, roughly 21.9% below the current price.
A short bounce after the first break is possible, as the red path shows, but it would not change the direction.
Price Levels to Watch
Support | Resistance |
$0.3214 | $0.3497 |
$0.2910 | $0.3780 |
$0.2635 | $0.4494 |
Bull, Base, and Bear Scenarios
Scenario | Setup | Level |
Bull | Weekly close above the falling trendline and $0.3497 on above-average volume | $0.3780, then $0.4494 |
Base | Price stays between the two trendlines as the triangle narrows. | $0.3214 to $0.3497 |
Bear | Weekly close below the rising trendline and $0.3214 | $0.2910, then $0.2635 |
TRX vs Bitcoin
TRX was flat against the dollar and lost 1.4% against Bitcoin over 24 hours. That implies Bitcoin rose about 1.4% while TRX stood still.
A strong BTC does not guarantee that TRX follows, so any triangle break should be confirmed on the TRX chart itself.
Anyone following this Tron price prediction 2026 outlook should watch both charts.
Expert Opinion
General market commentary on TRX is thin this week, and Tron news today was quiet in the material reviewed for this article.
That leaves price action as the clearest signal. The triangle is close to its apex, so a weekly close outside it is the event to watch.
For this Tron price prediction, a close above $0.3497 with volume favors buyers, while a close below $0.3214 favors sellers.
Disclaimer: This article is for information only and is not financial advice. Tron is a volatile asset, and a weekly close below $0.2635 could lead to deeper losses. Triangle patterns fail often, and no probability can be assigned to any scenario here. You can lose part or all of your capital, so do your own research before making any decision.













.webp)








