Cardano Price Prediction: Can Petrobras News Push ADA to $0.3132?

Cardano price prediction is the search lighting up right now, and the chart behind it is quietly asking traders a hard question. Two levels, one channel, and a headline from Brazil are all in play. Read this before the next candle answers it.
Our editorial desk holds no personal position in ADA. This is a chart and data read, nothing more.
Cardano Price Today: ADA Live Price, Volume, and Market Cap Data
The token trades near $0.2527, up 3.1% on the day, per CoinGlass. Market cap is $9.30B. Futures volume over 24 hours reached $658.64M against $125.17M in spot volume, so derivatives flow runs about 5.3 times spot.
Open interest, the total value of futures contracts still open, stands at $559.27M. Circulating supply is 36.77B out of a 45.00B maximum, so about 81.7% is already out.
Every level below uses the chart CMP (current market price) of $0.2530, not this snapshot.
Source: CoinGlass, October 1, 2026
Cardano News Today: Petrobras Fuel Data Project and ADA Price
Brazil just landed on the radar. BeInCrypto (@beincrypto) reported that Petrobras and the Cardano Foundation are working on two blockchain projects to track renewable fuel data, and ADA rose about 3% on the news. 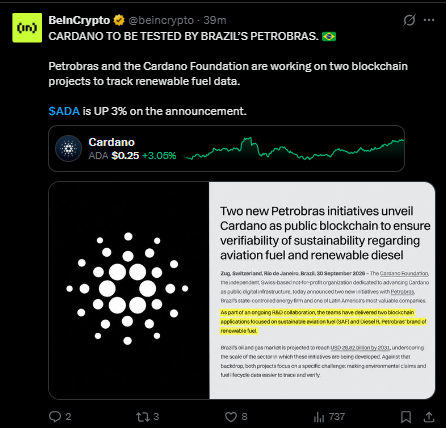
The attached release, dated September 30, says the teams delivered two applications as part of ongoing R&D, one for sustainable aviation fuel and one for renewable diesel.
The aim is verifiable sustainability claims on a public chain. That is a real-world data use case, not a speculative one. Our ADA staking rewards guide covers how the network rewards long-term holders.
Source: BeInCrypto (@beincrypto) on X, about 39 minutes old, October 1, 2026
Cardano Price Prediction Technical Analysis: ADA Price Forecast
Methodology: 1-hour timeframe, MEXC spot chart, the oscillator panel shown on the chart, and invalidation set at a 1-hour close below $0.2392.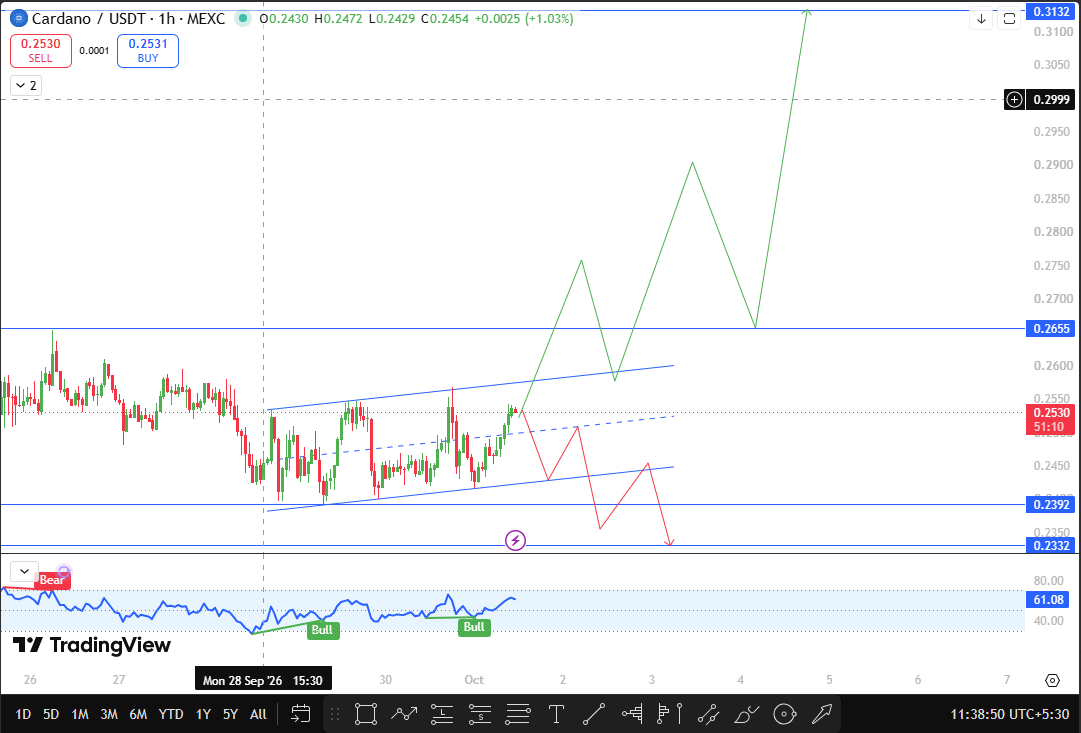
Price has been climbing inside an ascending channel, with higher lows along the lower line and higher highs near the upper one. It is now pushing up from the middle of the channel toward the upper edge.
A 1-hour close above $0.2655 would carry it clear of the channel and above that resistance, opening $0.3132, about 23.79% above CMP.
The projected path on the chart is a staircase, with pullbacks back toward $0.2655 before each new leg. A crypto breakout trading guide explains why a close matters more than a wick.
The failure case is just as defined. A 1-hour close below $0.2392 would break the channel structure and point to $0.2332, about 7.83% below CMP.
The bearish path shows a drop through the lower line, a weak bounce, and then a slide to that support.
The oscillator reads 61.08, firm but short of stretched. Two "Bull" divergence labels sit near recent lows, where momentum recovered before price did, and one "Bear" label sits far to the left.
The recent labels lean toward buyers, though the reading is not a signal alone.
Source: TradingView, Cardano/USDT 1H, MEXC, October 1, 2026, 11:38 AM IST
ADA Support and Resistance Levels: Key Cardano Price Targets
Level | Role | Distance from CMP |
$0.3132 | Major resistance and bullish target | +23.79% |
$0.2655 | Breakout trigger | +4.94% |
$0.2530 | CMP | 0.00% |
$0.2392 | Channel failure level | -5.45% |
$0.2332 | Next support | -7.83% |
Cardano Price Outlook: ADA Bull, Base, and Bear Scenarios Today
Bull case: A 1-hour candle closes above $0.2655. The channel is then behind it, and $0.3132 becomes the target, another 17.97% above the trigger.
The Petrobras story gives dip buyers a reason to show up, but price decides. Our altcoin breakout watchlist tracks similar moves.
Base case: Price keeps climbing and dipping inside the channel while the market decides about the upper edge. Bulls keep their structure, and the cost is patience.
Bear case: A 1-hour close below $0.2392 ends the setup. Sellers then aim at $0.2332, only 2.51% further down, so the fall could be quick once that level goes.
Cardano Price Risks: What Could Break the ADA Channel Breakout
Futures volume dwarfs spot volume, so liquidation wicks can poke through a level and snap back. Under our rule, a wick below $0.2392 that closes back above it is not a failure.
A news pop of about 3% can fade fast if buyers do not follow through. The lower support is only 2.51% below the failure level, so a break can run quickly. This is a single 1-hour read, and a wider market move can override it.
Trading Terms Glossary: Channel, Breakout, and Divergence Explained
Channel: two parallel trendlines that contain price as it rises or falls.
Breakout: price closing beyond a key level, such as a channel line or resistance.
Divergence: price and the oscillator moving in different directions, often hinting that momentum is changing.
Disclaimer
This article is for information and education only and is not financial advice. Crypto is volatile, and you can lose money. Do your own research and speak with a licensed advisor before investing.













.webp)








