Chainlink Price Prediction: Why Did LINK Fall 5%? What's Next


Chainlink has been carving out a tight, rising channel after its latest pullback, and the way price is behaving inside it says a lot about where LINK could be headed next.
This Chainlink price prediction breaks down the channel structure, what the spot ETF flow data has been showing, and the exact levels that will decide LINK's next major swing.
Position disclosure: No personal position is held in LINK. This is a purely technical and data-based read of the chart and market activity, not financial advice.
Chainlink Price Today: Live Data
LINK is priced at $12.401, down 5.08% over the past 24 hours. Futures volume for the period stands at $702.66M against spot volume of $135.72M, showing derivatives traders are more active than spot buyers right now.
Market cap sits at $9.28B with open interest at $654.11M. Circulating supply is 748.09M LINK out of a fixed total and max supply of 1.00B, meaning nearly the entire token supply is already in circulation.
Source: CoinGlass, September 24, 2026
Chainlink Spot ETF Flows Today
LINK spot ETF products have quietly strung together four positive inflow days in a row. 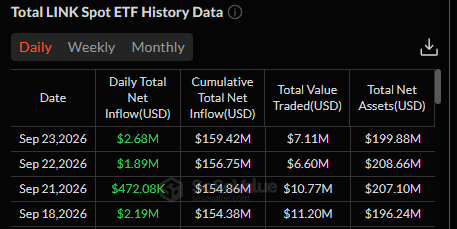
Sep 18 brought in $2.19M, followed by $472.08K on Sep 21, then $1.89M on Sep 22 and $2.68M on Sep 23, the strongest single-day print of that stretch.
Cumulative net inflow has climbed from $154.38M to $159.42M across those sessions, while total net assets rose from $196.24M to $199.88M.
It is not a massive wave of capital, but the consistency of daily inflows without a single red day stands out as a quietly bullish signal for Chainlink trend analysis heading into the next few sessions.
Source: SoSoValue, September 23, 2026
Quick Take
CMP: $12.415 (1h chart)
Bullish trigger: close above $13.284
Bearish trigger: close below $12.054
Data snapshot: September 24, 2026
Risk note: $LINK is down over 5% in 24 hours even while trading inside a rising channel, so a channel failure could move fast
Chainlink Price Prediction 2026 Technical Analysis
The 1h LINK/USDT chart on Binance shows Chainlink working its way higher inside a clean ascending channel after bouncing off support near $12.054.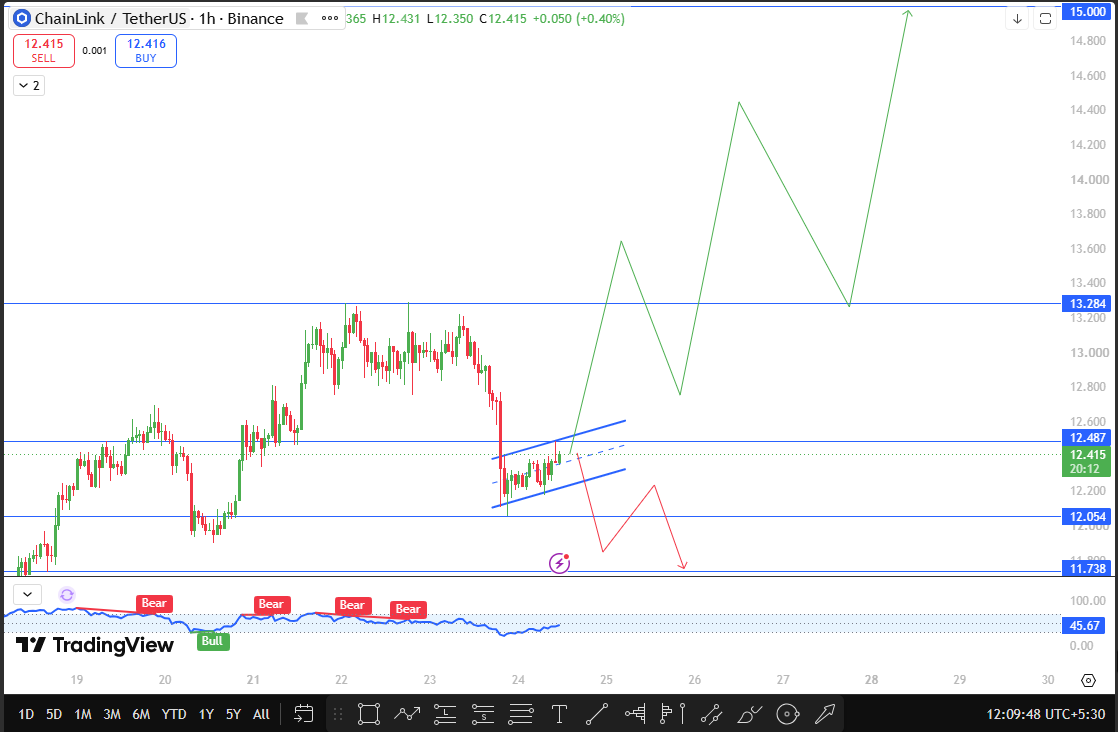
Both boundaries of the channel are rising in tandem, and price has been respecting them candle after candle, which is generally read as controlled, orderly buying rather than a chaotic squeeze.
Underneath the price action, the momentum indicator backs this up; it had thrown four separate bear signals during the earlier decline but has now flipped to a bull reading at 45.67, right as price stabilized inside the channel.
For this Chainlink technical analysis, the channel's upper boundary lines up closely with $13.284, and a one-hour close above that level would confirm LINK is breaking out of the channel to the upside, opening the door toward the $15.00 zone as the next major resistance target.
If instead the price loses the bottom of the channel and closes below $12.054, that breaks the bullish structure entirely and shifts the picture toward $11.738 as the next support.
The ETF inflow trend adds a layer of fundamental support to the bullish case, since steady capital entering LINK products tends to cushion pullbacks even when short-term price action looks shaky.
Chart: TradingView, ChainLink/TetherUS, 1h Binance, September 24, 2026
LINK Support and Resistance Levels
Level Type | Price | Distance from CMP |
Resistance 2 | $15.00 | +20.8% |
Resistance 1 | $13.284 | +7.0% |
Current Price | $12.415 | — |
Support 1 | $12.054 | -2.9% |
Support 2 | $11.738 | -5.5% |
Bull, Base, and Bear Case
In the bullish scenario, LINK keeps riding the ascending channel, momentum stays in bull territory, and a one-hour close above $13.284 confirms the breakout, setting up a push toward the $15.00 level next.
The base case has LINK continuing to climb gradually inside the channel without a decisive break either way, letting the ETF inflows accumulate quietly while price consolidates its recent gains.
The bear case triggers if $12.054 breaks on a closing basis, which would undo the channel structure and open room toward $11.738, especially if ETF inflows were to stall or reverse alongside that move.
Risks to Watch
LINK's 24h decline of over 5% even inside a rising channel shows the broader market backdrop is not fully cooperating with this bullish structure, and a sharp move in Bitcoin could easily override the channel pattern.
The relatively small size of daily $LINK ETF inflows, in the low single-digit millions, means the trend could flip with just one or two weaker sessions, so this is a signal worth watching rather than treating as a guaranteed tailwind.
LINK 2030 Price Outlook
Chainlink's path to 2030 will likely depend on how deeply its oracle infrastructure gets embedded across both DeFi and the growing wave of institutional tokenization projects that need reliable off-chain data feeds.
The steady, if modest, climb in LINK spot ETF assets suggests a base of investors treating LINK as a longer-horizon holding rather than a short-term trade, and if that behavior persists alongside continued integration wins, LINK has a reasonable case for materially higher valuations than today's levels by the end of the decade.
Glossary
Ascending channel: A price pattern formed by two parallel, rising trendlines that contain price action within a defined range.
Net inflow: The amount of new capital entering an ETF product on a given day, after accounting for any outflows.
Open interest: The total value of outstanding derivative contracts on an asset that have not yet been settled.
Breakout: A decisive move beyond a chart pattern's boundary, often signaling the start of a fresh directional trend.
Disclaimer
This article is for informational purposes only and does not constitute financial advice. Cryptocurrency markets are highly volatile, and any trading or investment decisions should be made after conducting independent research.

















