Chainlink Price Prediction: LINK Eyes $15 As ECB Tokenization Grows

There is a pattern forming on the LINK chart that tends to catch the eye of anyone tracking momentum plays, and this chainlink price prediction breaks down exactly what that pattern is telling traders right now.
Before getting into the chart, a quick note that this is a purely technical and data-based read, not a personal position or financial advice.
Chainlink Price Today: Live Data
LINK is priced at $12.87, up 2.25% on the day. Futures volume over the past 24 hours stands at $797.29M against spot volume of $175.46M, showing that derivatives activity is leading this move by a solid margin.
Open interest sits at $675.50M, and market cap is $9.64B. Circulating supply is 748.09M LINK out of a total and max supply of 1.00B, meaning the vast majority of eventual supply is already in circulation.
Source: CoinGlass, September 22, 2026
Chainlink News Today
The chainlink news today comes from ALLINCRYPTO, which flagged that the European Central Bank's Project Pontes, evolving into a broader initiative called Appia, has a direct connection to both XLM and LINK. 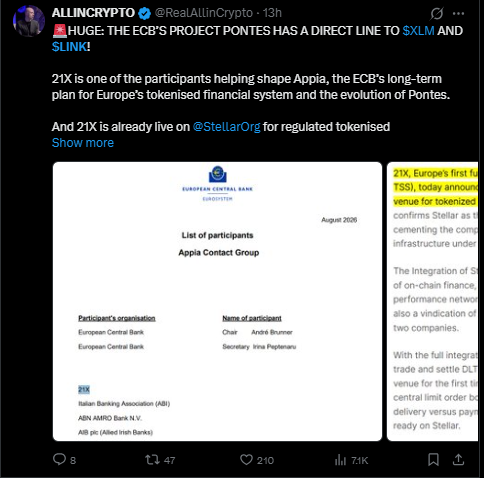
According to the post, 21X is listed as one of the participants helping shape Appia, the ECB's long-term plan for Europe's tokenized financial system.
The post noted that 21X is already live on the Stellar network for regulated tokenized settlement, positioning it as one of the pieces linking traditional European financial infrastructure to both Stellar and Chainlink's staked LINK ecosystem.
While the full details of how deep this integration runs were not fully laid out in the post, the framing suggests Chainlink is being looked at as part of the plumbing for future European tokenized finance, which is the kind of institutional narrative that tends to matter more over months than over the next few candles.
Source: ALLINCRYPTO on X, September 22, 2026
Quick Take
CMP: $12.868 on the 1-hour Binance chart
Bullish trigger: close above $13.686
Bearish trigger: close below $12.355
Data timestamp: September 22, 2026
Risk note: this setup has already produced two successful higher highs, so a third failed retest would be a meaningful warning sign
Chainlink Price Prediction 2026 Technical Analysis
On the 1-hour LINK/USDT chart on Binance, the price has been climbing steadily along a well-defined ascending trendline for the past several sessions. 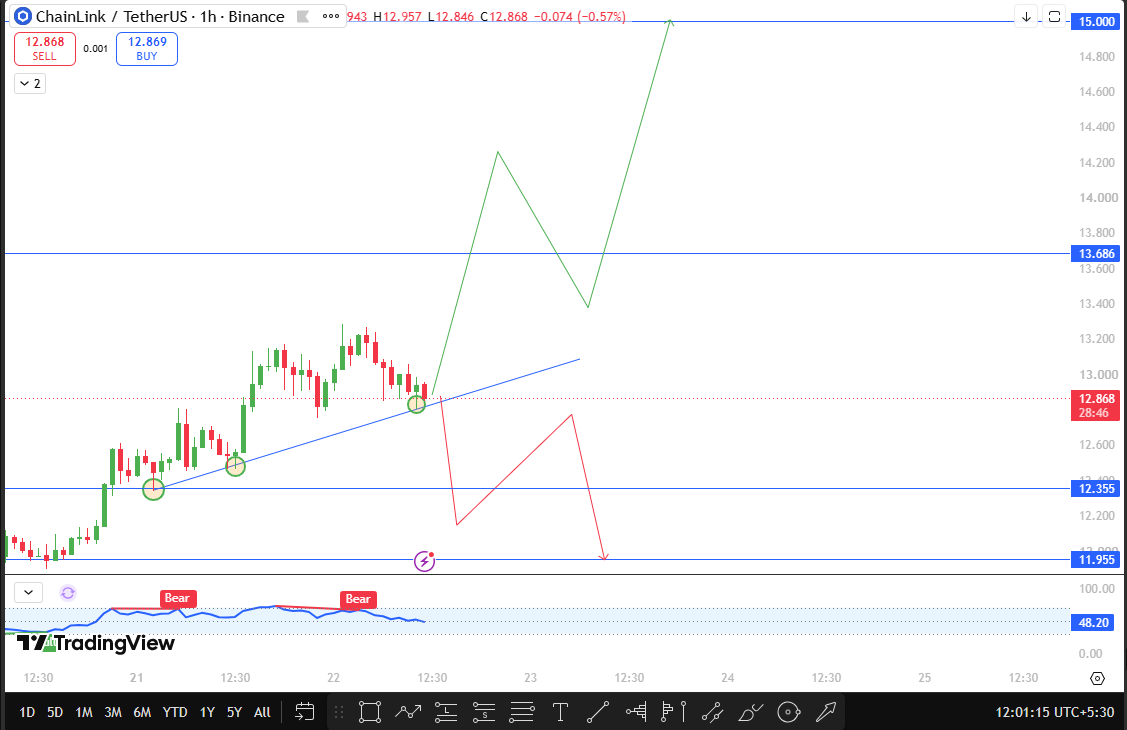
What stands out here is that LINK has already tested this trendline twice and bounced both times, with each retest producing a new higher high rather than just a flat repeat of the previous peak.
That kind of repeated strength off the same support line is generally read as a sign that buyers keep stepping in with more conviction each time price dips toward it.
The oscillator panel below the chart shows two separate Bear labeled readings during this climb, with the current level sitting at 48.20, essentially in neutral territory rather than at an overbought extreme.
That leaves some room for price to keep climbing without immediately running into exhaustion signals.
If LINK closes above $13.686, that would confirm a breakout from the current range and open the door toward $15.000, a level that also lines up as a fairly clean psychological round number. If instead the trendline gives way and LINK closes below $12.355, the next real support to watch sits at $11.955, and losing that zone would suggest the recent run of higher highs has come to an end.
Chainlink Support and Resistance Levels
Level Type | Price | Distance from CMP ($12.868) |
Resistance 2 | $15.000 | 16.57% above |
Resistance 1 | $13.686 | 6.36% above |
Current Price | $12.868 | - |
Support 1 | $12.355 | 3.99% below |
Support 2 | $11.955 | 7.09% below |
LINK Bull, Base, and Bear Case
In the bullish scenario, LINK keeps riding its ascending trendline, closes above $13.686, and pushes toward $15.000, helped along by the institutional tailwind from the ECB-linked tokenization news.
With open interest already sitting above $675M, a confirmed breakout here could draw in fresh leveraged positioning fairly quickly.
In the base case, LINK spends more time consolidating between $12.355 and $13.686 while the market digests both the recent run-up and the details of exactly how deep the ECB and 21X connection to Chainlink actually go.
Given how far price has already climbed in a short window, a pause here would not be surprising.
In the bearish scenario, the trendline finally breaks after holding through two prior tests, LINK closes below $12.355, and the pattern of higher highs gives way to a deeper pullback toward $11.955, which would suggest the recent institutional narrative was not enough to keep momentum buyers engaged.
Risks to Watch
With futures volume running well above spot volume, LINK remains sensitive to liquidation-driven swings if price moves sharply through either the trendline or the marked support and resistance zones.
The ECB and 21X connection is still an evolving story, and any lack of follow-through on the details could cool sentiment just as quickly as it built.
Broader market conditions across major altcoins could also override LINK's own chart structure in either direction.
Chainlink Price Prediction 2030 Long-Term Outlook
Looking toward 2030, Chainlink's positioning inside Europe's evolving tokenized finance plans is the kind of development that could matter far more than any single week's price action.
A central bank-level initiative like Project Pontes exploring direct lines to LINK suggests Chainlink's oracle and staking infrastructure is being treated as foundational rather than optional for future on-chain settlement systems.
If European regulators and institutions keep building around this kind of infrastructure over the next several years, LINK's role as connective tissue between traditional finance and blockchain settlement could end up being worth considerably more than today's price reflects, though how much more is genuinely hard to pin down this far out.
Glossary
Ascending Trendline: A line drawn along a series of rising lows, used to track ongoing upward momentum
Higher High: A price peak that sits above the previous peak, often read as a sign of continued strength
Open Interest: The total value of outstanding futures contracts that have not yet been settled
Tokenized Finance: The process of representing traditional financial assets or settlement systems using blockchain-based tokens
Disclaimer
This article is for informational purposes only and should not be treated as financial or investment advice. Cryptocurrency markets are highly volatile, and readers should conduct their own research before making any trading decisions.
















