Bitcoin Price Prediction: BTC Eyes $100K After Massive Short Squeeze


Bitcoin is trading at $85,415.50 today, up 4.62% in the last 24 hours. The move came after a sharp short squeeze wiped out weak bets against the price.
This Bitcoin price prediction looks at where BTC could go next using real market data. That includes futures volume, ETF flows, sentiment scores, and support levels.
Bitcoin's market cap now sits at $1.71 trillion. Open interest is at $61.40 billion, and 24-hour futures volume hit $116.90 billion.
What Is Bitcoin Price Today?
Bitcoin broke above $85,000 for the first time since January. A short squeeze pushed the rally along, with about $648 million in bearish crypto bets liquidated.
Falling oil prices also helped. Cheaper oil tends to ease inflation worries, which can make investors more willing to hold riskier assets like crypto.
Out of the $611.99 million liquidated over the past day, $535.27 million came from short positions. Only $76.72 million came from longs. That tells you shorts got caught off guard.
Metric | Value |
BTC Price | $85,415.50 |
24h Change | +4.62% |
Market Cap | $1.71T |
Futures Volume (24h) | $116.90B |
Open Interest | $61.40B |
Long/Short Ratio | 1.0525 |
24h Liquidations | $611.99M |
Why Did Bitcoin Holders Sell Before Bitcoin Price Hit $85K?
Data shows 62,335 wallets holding 0.1 to 1 BTC vanished during the July-August pullback. Another 7,159 wallets holding 1 to 10 BTC also disappeared.
These smaller holders sold near the bottom. Then Bitcoin turned around and reclaimed $80,000 shortly after.
This is a pattern seen before. When smaller, less patient holders panic-sell, it often leaves fewer coins in weak hands. That can set up conditions for a rally once bigger buyers keep absorbing supply.
It is not a rule that always works. But history shows fear near lows and FOMO near highs tend to mark turning points more often than not.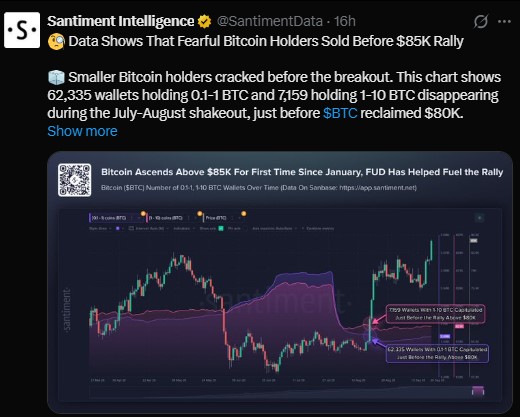
What Is the Bitcoin Fear and Greed Index Today?
The Fear and Greed Index now reads 78, which is Extreme Greed. Yesterday it was 70. Last week it was 69. Last month it was only 66.
Sentiment has flipped fast. Talk of Bitcoin going even higher has surged to its highest level since 2024, according to Santiment data.
Open interest also climbed 7.6% to about $156 billion, even after shorts got wiped out. That means traders are opening fresh leveraged bets instead of stepping back.
Total crypto trading volume also jumped 39% in 24 hours during the move. That kind of spike usually means the crowd has shifted from sitting on the sidelines to chasing price.
This is where it pays to be careful. Crowded optimism near highs has, in the past, come right before pullbacks. That does not mean a drop is guaranteed, but risk is higher now than when fear was in the market last week.
Is Bitcoin Trading Volume Rising in 2026?
On the weekly chart, Bitcoin reclaimed its 50-week moving average and printed a higher high compared to the prior week. That kind of move often draws in more buyers who watch longer-term trends.
Corporate buying has picked up alongside the chart pattern. Strategy (MSTR) and Strive have both been adding to their Bitcoin holdings during this stretch.
Bitcoin and major altcoins together posted their strongest combined weekly trading volume since the opening week of March. That is a big jump in participation compared to recent months.
Rising volume can back up a breakout as long as real buyers keep showing up. But another vertical spike in volume from here could start to look more like FOMO than fresh demand, so it is worth watching whether volume holds or fades.
How Much Money Is Flowing Into Bitcoin ETFs?
Spot Bitcoin ETFs pulled in $999 million in net inflows on September 21, based on SoSoValue data.
Over the past 30 days, that adds up to $2.45 billion. Total net inflows since launch now stand at $56.16 billion.
BlackRock's IBIT led the day with $381.37 million. Fidelity's FBTC brought in $238.84 million. Total ETF assets are $110.14 billion, or 6.30% of Bitcoin's total market cap.
Steady ETF demand has been one of the quieter forces behind this rally. Big buyers like Strategy (MSTR) also added 950 BTC recently and repurchased $174 million worth of STRC.
Bitcoin Price Prediction: Key Levels to Watch
On the weekly chart, Bitcoin found support in the $60,000 to $70,000 zone earlier this year. It has since reclaimed the $78,600 area.
If buyers keep pushing, resistance levels sit around $92,100, then $100,200, and $111,700. A clean break above $92,100 could open a path toward six figures.
After briefly touching $87,000, Bitcoin pulled back. The next key resistance zone is $90,000 to $92,000, which lines up with the 0.5 Fibonacci level.
On the way down, $82,000 is now the level to watch. It was resistance before and has flipped into support. Holding above it keeps this recovery intact.
Below that, $78,600 and $73,700 are the next support zones. A break under those could bring $69,000 to $60,000 back into the conversation.
Level Type | Price Zone |
Resistance 1 | $90,000–$92,100 |
Resistance 2 | $100,200 |
Resistance 3 | $111,700 |
Support 1 | $82,000 |
Support 2 | $78,600 |
Support 3 | $73,700 |
Support 4 | $60,000–$69,000 |
Bitcoin Price Prediction: Will BTC Hit $100K?
Bitcoin's rally has real drivers behind it. Strong ETF inflows, a wave of short liquidations, and falling oil prices have all played a part.
But Extreme Greed readings and climbing open interest suggest the market may be getting a little ahead of itself. Traders chasing this move should watch the $82,000 support and $92,100 resistance closely.
Macro conditions matter too. If inflation keeps easing thanks to lower oil prices, that could support further gains toward $100,000 this year. Nothing here is a guarantee, and crypto can turn quickly in either direction.
Disclaimer
This article is for informational purposes only and does not constitute financial, investment, or trading advice. Cryptocurrency markets are highly volatile and risky. Always do your own research and consult a licensed financial advisor before making investment decisions.
















