Crude Oil Price Prediction October 2026: Trump Rejects Iran Truce


Crude oil price prediction October 2026 is suddenly one of the most watched topics in the markets. WTI just posted a big green candle, a fresh geopolitical headline landed at the same time, and the chart happens to be sitting on one of its cleanest structures of the year. Here is how it all connects.
Editorial note: our desk holds no personal position in WTI. This is purely a chart and data read.
Crude Oil Price Today: Live WTI Data
WTI crude is trading at 95.61, up 3.16 or 3.42% on the day. The session opened at 93.58, dipped to 92.68, and pushed as high as 95.75 before closing near the top of the range.
That is a strong recovery candle after a rough stretch of pullback. For a look at another trendline setup on a different market, see our gold price prediction today.
Source: TradingView, WTI Crude Oil CFD, 1D, TVC, Sep 28, 2026, 15:11 UTC+5:30
Crude Oil News Today: Trump Rejects Iran Truce Offer
What Happened
A post from Channels Television (@channelstv) reports that oil prices spiked on Monday after Donald Trump rejected an Iranian offer of a seven-day truce. Bond yields moved higher at the same time, while stocks were mixed.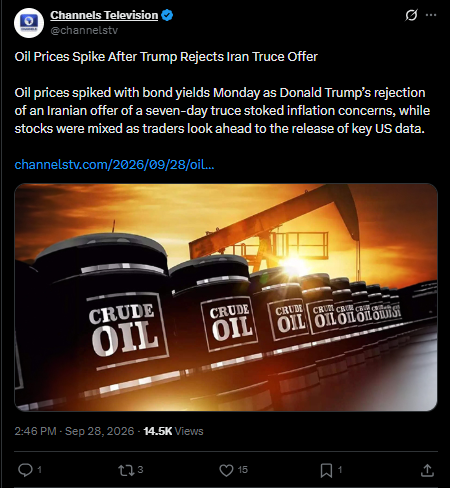
Why It Matters for Oil
A rejected truce keeps the tension alive, and that tension is what markets price into crude. When traders fear supply trouble, oil tends to jump quickly, which is what this candle shows.
The Inflation Link
The post says the move stoked inflation concerns. Pricier oil feeds into fuel and shipping costs, and that can push yields up, which is why oil and bonds moved together today. Readers following the wider picture can also read our US dollar index forecast.
What to Watch Next
Traders are now looking ahead to key US data, so volatility could stay high this week.
Source: Channels Television (@channelstv) X post, Sep 28, 2026, 2:46 PM
Quick Take
CMP: 95.61 (daily chart, TVC)
Bullish trigger: daily close above 106.83
Failure level: daily close below 79.66
Data timestamp: Sep 28, 2026, 15:11 UTC+5:30
Risk note: headline-driven spikes can fade as fast as they arrive.
Crude Oil Price Prediction October 2026 Technical Analysis
WTI has been a textbook trend trade since early July. Price bounced off the low near 67 and has ridden a strong ascending trendline ever since, with the chart showing three clear touches of that line. 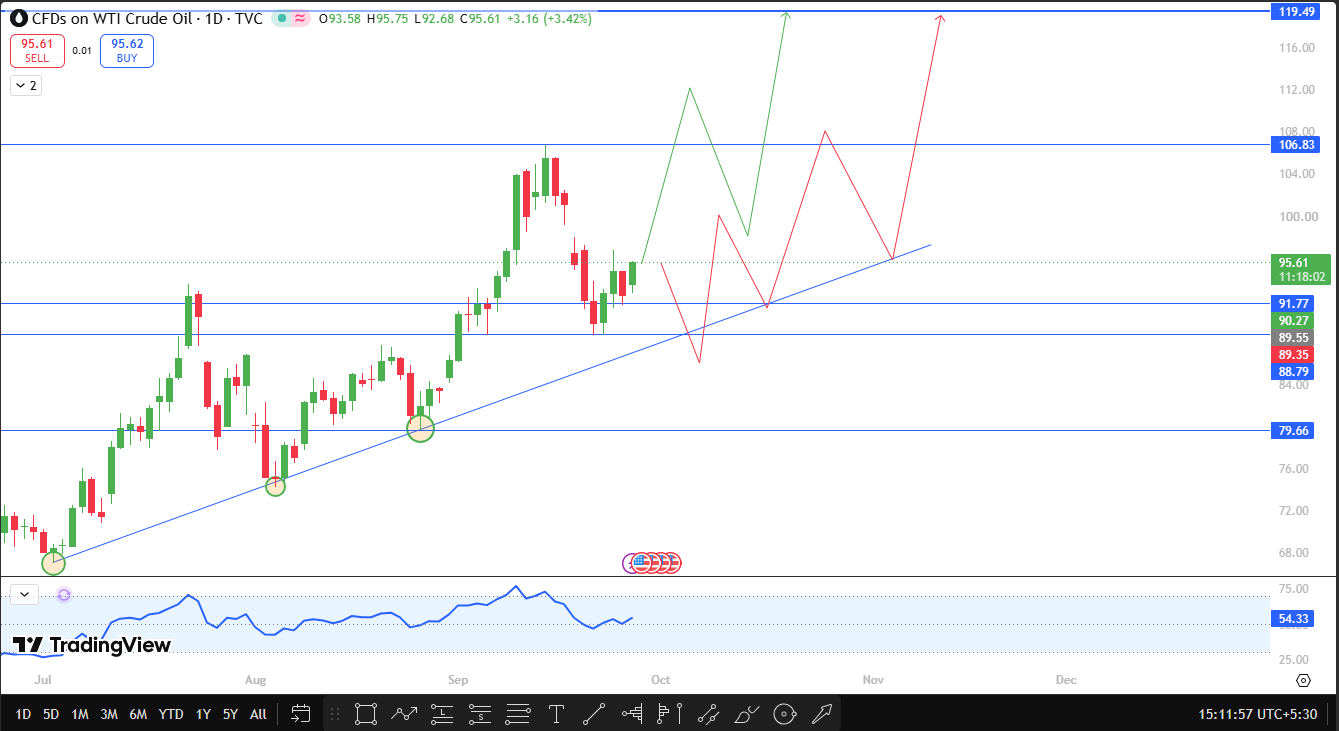
The first retest, in early August near 74.5, kicked off a powerful advance toward the 93 area. The second retest, in late August near 80, did even more. It sent price through the earlier high and carved out a new higher high at 106.83 in mid-September.
Since that peak, crude has cooled off. Price slipped back into the high 80s, and today's 3.42% candle to 95.61 is the first strong bounce out of that dip.
The rising trendline now sits in the high 80s, well below the current price, so buyers have plenty of cushion. The oscillator reads 54.33, a neutral zone after cooling from its mid-70s peak, which leaves room for movement in either direction.
The bullish path is simple. If WTI breaks directly above 106.83 and closes there on the daily chart, it would take out the September high and clear the way for 119.49, the extended target on the chart. That would confirm the trend is alive and still making higher highs.
The chart also allows for a deeper pullback first. Price could revisit the trendline before the next leg up, and nothing about that would damage the trend.
As long as WTI holds above 79.66, which lines up with the area of the second retest low, the structure stays bullish. A daily close below 79.66 would invalidate the setup, since it would break the pattern of higher lows that has driven the whole rally.
Between 79.66 and 106.83, expect swings, especially with geopolitical headlines in play.
Source: TradingView, WTI Crude Oil CFD, 1D, TVC, Sep 28, 2026, 15:11 UTC+5:30
Crude Oil Support and Resistance Levels
Level | Type | Distance from CMP (95.61) |
119.49 | Extended resistance | +24.98% |
106.83 | Breakout trigger | +11.74% |
91.77 | Nearby chart support | -4.02% |
79.66 | Major support and invalidation | -16.68% |
Bull, Base, and Bear Scenarios for WTI
Bull case. Crude holds its footing, pushes higher, and closes above 106.83 on the daily chart. Continued Iran tension would be the fuel. From there, 119.49 is the next big stop, and pullbacks along the way would be normal. Traders watching risk assets can check our Bitcoin price outlook this week.
Base case. WTI ranges between the high 80s and 106.83, while the market waits on US data and Iran headlines. Neither side gets full control, and the trendline keeps acting as a floor. This is the most likely near-term outcome.
Bear case. A calmer geopolitical picture or softer demand drags price back toward the trendline and then deeper. Buyers could defend the area, but a daily close below 79.66 would cancel the setup entirely.
Risks to Watch
Oil can reverse sharply on a single headline, especially one tied to negotiations. Today's jump came from news, not from a change in the chart, so it could fade if talks improve.
Rising yields alongside oil can also pressure the wider market and hurt demand expectations. A big miss in the upcoming US data would shake things further.
Glossary
Retest: price returns to a level or trendline to see if it holds.
Higher high: a peak that sits above the previous peak.
Disclaimer
This article is for educational and informational purposes only and is not financial advice. Commodity markets are highly volatile. Do your own research before making any trading decision.

















