US Oil Price Prediction: Will Hormuz News Push WTI Past $104?


US oil is trading about 12% below its mid-September high, yet a fresh report on the Strait of Hormuz keeps supply worries alive.
That mix frames this US oil price prediction and the wider US oil price prediction September 2026 outlook.
US oil is tracked by West Texas Intermediate (WTI), the main crude benchmark in the United States. WTI is delivered at Cushing, Oklahoma, and is quoted in dollars per barrel.
The US oil price today stands at $92.75 per barrel, up $0.05, or 0.05%, as of 12:11 IST.
The crude oil price today sits well under the September peak, and anyone checking the WTI price today will see a market that has barely moved in the past few hours.
Live WTI Market Data
Metric | Value |
Instrument | WTI Crude Oil (CFD) |
Price | $92.75 per barrel |
Change | +$0.05 (+0.05%) |
4H Open | $92.117 |
4H High | $92.814 |
4H Low | $91.907 |
4H Last | $92.562 (+0.48%) |
Source: TradingView (TVC USOIL and FXCM WTI CFD), as of September 24, 2026, 12:11 to 12:21 IST.
US Oil News Today: Hormuz Talks Stall
The latest US oil news comes from a social media post that says the US has rejected an Iranian proposal to reopen the Strait of Hormuz.
The post adds that Iran reportedly asked the US to lift its naval blockade and release all frozen Iranian assets.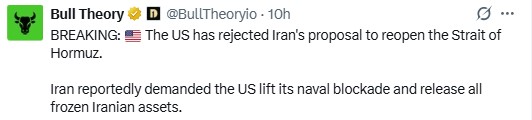
Source: Data Taken From @BullTheoryio, X Account, as of Sep 24, 2026
This report has not been confirmed by an official statement in the data reviewed, so it should be read as unverified.
The strait carries a large share of global oil shipments, which is why any headline about it draws the attention of crude traders.
For readers following US oil news today, the reaction so far is small. The price is up only 0.05%, so the market may be waiting for confirmation.
A stalled deal would normally keep supply concerns alive. The chart, however, shows buyers have not yet cleared the nearest resistance.
US Oil Price Prediction: 4H Technical Analysis
This US oil technical analysis uses the 4-hour WTI CFD chart from FXCM on TradingView, captured at 12:21 IST (UTC+5:30) on September 24, 2026.
It was still forming at capture, with a last price of $92.562. The spot quote of $92.75 comes from a different feed and time, which explains the small gap.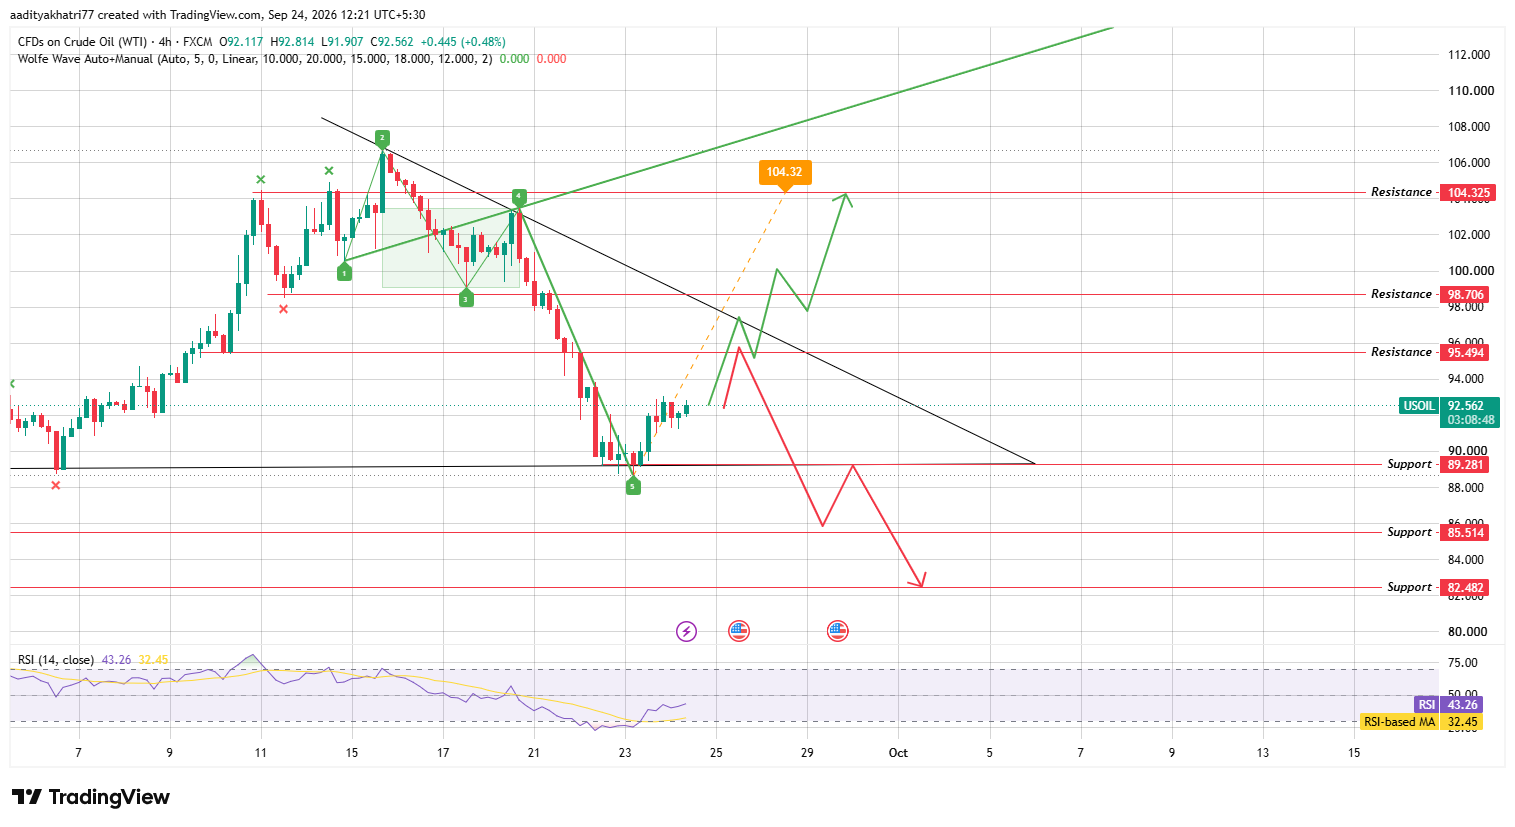
Source: Chart taken from TradingView, as of Sep 24, 2026
WTI is trading inside a descending triangle. A falling trendline from the September 15 high cap price is from above, while a flat base near $89.281 holds from below. That same base marked a low in early September.
On September 23, the price wicked slightly under it and then recovered, which completed the fifth point of a Wolfe Wave pattern.
The projected target of that pattern is $104.32.
The drop from the September 15 high, above $106, to the September 23 low measured roughly 17%.
The RSI now reads 43.26, above its moving average of 32.45 but still under the 50 midline. Momentum has recovered from the oversold area and remains weak.
A descending triangle is usually read as bearish, since sellers keep making lower highs against a fixed floor. Buyers need a break from the falling trendline to change that view.
Can US Oil Break Resistance and Move Higher?
The bullish case starts with a bounce from the $89.281 base. The first hurdle is $95.494, about 3.2% above the chart price.
Next comes $98.706, roughly 6.6% higher. The falling trendline runs through the same area over the coming week, so the breakout zone is crowded.
A 4H body close above $98.706 and above the trendline would confirm the move. Volume should be at least 1.5 times the average of the previous 20 candles. A wick above the line without such a close does not count.
The upside level is $104.325, about 12.7% above the chart price. It matches the Wolfe Wave target of $104.32, which adds weight to the zone.
The chart also allows a retest of the trendline before the final leg, which would be a normal pullback. That path keeps the short-term US oil price prediction constructive.
What Happens If US Oil Is Rejected at Resistance?
The bearish case begins with rejection near $95.494 or at the falling trendline. Price would then slide back to the $89.281 base.
A 4H body close below it would break the triangle floor.
The next downside level is $85.514, about 7.6% under the chart price. Below it sits $82.482, roughly 10.9% lower.
The chart marks a small bounce back toward $89.281 before the last leg down, so the fall may not be a straight line.
US Oil Price Levels
The table lists the US oil price levels from the 4H chart.
Support | Resistance |
$89.281 | $95.494 |
$85.514 | $98.706 |
$82.482 | $104.325 |
Bull, Base, and Bear Scenarios
Each path below feeds into the wider US oil price forecast.
Scenario | Setup | Level |
Bull | 4H body close above $98.706 and the falling trendline with strong volume | $104.325 |
Base | Price holds above $89.281 but stays under $95.494. | $89.281 to $95.494 |
Bear | 4H body close below $89.281 | $85.514, then $82.482 |
US Oil Market Sentiment
US oil market sentiment looks divided. Price has fallen about 12% from its mid-September high and stays under a falling trendline, which favors sellers.
Buyers have their own case: RSI recovered from oversold territory, and the $89,281 base was held on September 23.
Geopolitical headlines add a second layer. Because the Hormuz report is unconfirmed, sentiment could shift fast once an official statement arrives in either direction.
Any US oil forecast for the coming week should track $95.494 and $89.281 first and headlines second.
Expert Opinion
General market commentary on crude oil often separates chart signals from headline risk. Analysts usually treat a descending triangle as bearish until the price closes above the falling trendline.
Supply news from the Gulf then adds sudden swings that charts alone cannot predict.
Any US oil price prediction should sit beside a fixed exit plan. WTI lost roughly 17% in eight days, and gaps between levels can be wide.
Disclaimer: This article is for information only and is not financial advice. WTI is volatile, and geopolitical headlines can cause sudden price gaps. CFD trading uses leverage and can lead to losses larger than the amount invested. Technical levels can fail, and price can move against every scenario above. The scenarios carry no stated probability. Do your own research and never risk money you cannot afford to lose.

















