US Oil Price Prediction: Iran Tensions, Diesel Shock Put WTI on Alert

US oil price prediction interest is spiking, and geopolitics is doing most of the work this time.
Compare that to CoinGabbar's Bitcoin price prediction coverage, where technicals usually lead the story more than headlines do. WTI Crude Oil is the opposite case right now.
According to a post from The Kobeissi Letter, diesel supply from the Middle East and Russia has dropped by an estimated 1.1 million barrels per day combined since last year.
WTI, short for West Texas Intermediate, is the benchmark price for crude oil produced in the United States and traded on futures markets worldwide. It's one of the most watched commodities in global finance.
And this week, two separate headlines are pulling US oil in different directions at once.
US OIL is trading near $92.49, down close to 7% on the week. The weekly range ran from $88.66 to $101.04.
US Oil Price Today reflects a market caught between falling supply and rising war risk.
Live Market Data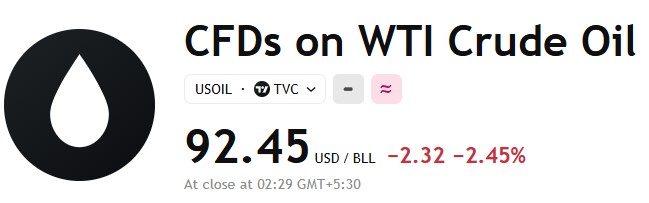
Source: Live WTI Crude Oil market snapshot, as of Sep 26, 2026, 10:31 UTC.
Diesel Supply Crisis Update
A post from The Kobeissi Letter, published around Sep 25, 2026, 22:31 UTC, laid out a stark supply picture.
Diesel supply from the Middle East reportedly fell by an average of 772,667 barrels per day between March and August 2026 compared to the same period a year earlier, based on estimates from Vortexa, Kpler, and Energy Aspects.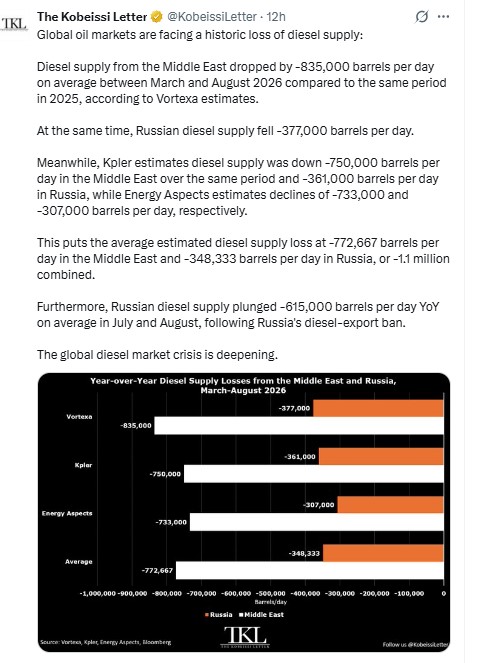
Source: Data taken from @KobeissiLetter, X account, as of Sep 26, 2026.
The Russian diesel supply dropped by an estimated 348,333 barrels per day over that same window. Combined, that's a loss of roughly 1.1 million barrels per day.
Following Russia's diesel export ban, the post noted an even sharper year-over-year drop of 615,000 barrels per day in July and August alone.
That's a supply shock, not a rounding error.
Iran War Escalation Risk
Breaking developments add another layer. A separate post from The Kobeissi Letter, published around Sep 26, 2026, 00:31 UTC and citing the Wall Street Journal, reported that President Trump has rejected Iran's proposal for a seven-day ceasefire.
The post said Trump has told aides he expects to begin bombing Iran after the November midterms.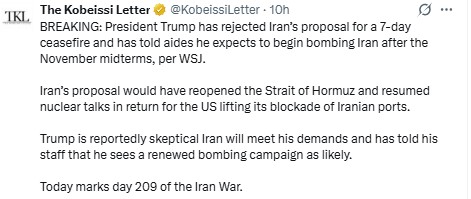
Source: Data taken from @KobeissiLetter, X account, as of Sep 26, 2026.
Iran's rejected proposal would have reopened the Strait of Hormuz and resumed nuclear talks in exchange for the US lifting its blockade of Iranian ports.
Per the same post, Trump is described as skeptical Iran would meet his demands, with today marked as day 209 of the ongoing conflict.
A blocked Strait of Hormuz matters enormously for oil. And a huge share of global crude shipments pass through it daily.
Technical Analysis
This US Oil Technical Analysis starts with the pattern squeezing price on the weekly chart.
WTI sits inside a symmetrical triangle, a pattern formed by a falling trendline from above and a rising trendline from below narrowing toward a point. 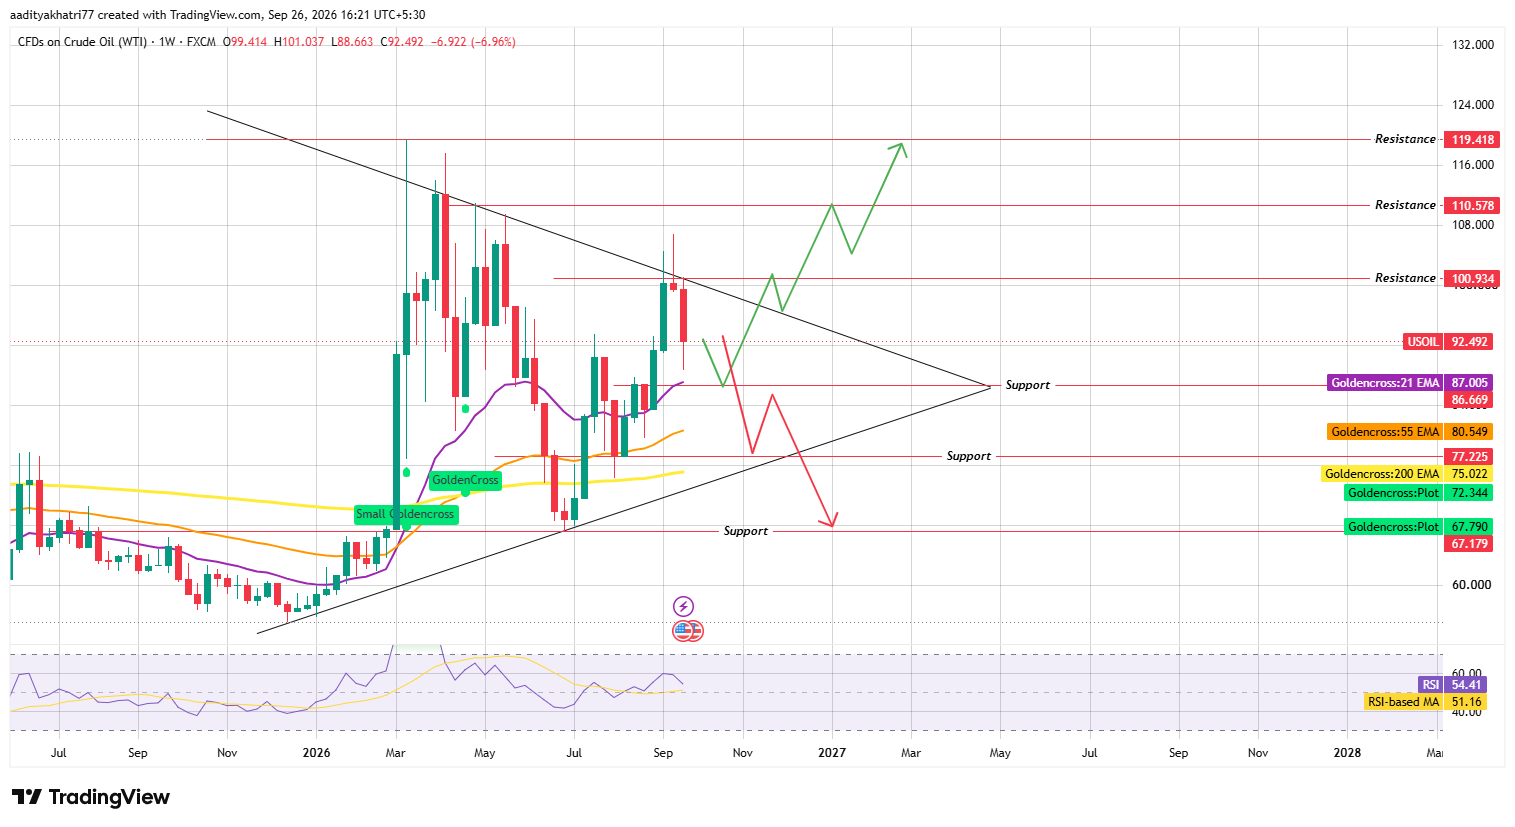
Source: Chart taken from TradingView, as of Sep 26, 2026
RSI reads 54.41, just above its moving average of 51.16.
That's a mild bullish lean, and it lines up with the supply-side headlines above.
Can WTI Push Toward Higher Resistance?
A bounce off support followed by a weekly trade above the falling trendline, backed by real volume, opens the path toward $100.93 first.
Clear that zone and $110.58 comes into view, with $119.42 as the extended target if the geopolitical risk premium keeps building.
That's the bullish case. And it needs both the chart and the headlines to keep pointing the same way.
What Happens If WTI Breaks Support?
Rejection at resistance changes the picture fast. And a break of the $77.22 support zone and the rising trendline below it would send WTI toward $67.18 next.
Turns out, even a war-driven supply shock doesn't guarantee a straight line higher.
Breakdowns from wide weekly triangles tend to take longer to unfold than crypto charts. Fine. That's the nature of a commodity most of the world depends on daily.
EMA Levels (Weekly Chart)
EMA | Level |
21 EMA | $87.01 |
55 EMA | $80.55 |
200 EMA | $75.02 |
Support | Resistance |
$86.66 | $100.93 |
$77.22 | $110.58 |
$67.18 | $119.42 |
Source: Weekly WTI crude oil chart, candle Sep 26, 2026, 10:31 UTC.
Bull, Base, and Bear Scenarios
Scenario | Setup | Level |
Bull | Trendline break with volume | $100.93 to $119.42 |
Base | Triangle holds, range trade | $87.01 to $100.93 |
Bear | Support and trendline break | $86.66 to $67.18 |
What These Headlines Mean for Oil
Both catalysts push in the same bullish direction, through different channels. The diesel crisis tightens the physical market by squeezing refined-product output, while the Iran war risk adds a geopolitical premium tied to potential Strait of Hormuz disruption.
Together, they explain why the weekly RSI leans mildly bullish even as WTI sits mid-triangle.
That said, the war angle is probability-priced, not confirmed. But any ceasefire news could unwind that premium fast.
Crude oil price prediction models built purely on charts miss that risk entirely.
Methodology
This US Oil Price Prediction was built from a weekly WTI crude oil chart sourced through FXCM via TradingView, checked candle by candle for the triangle boundaries and EMA levels.
Diesel supply and geopolitical figures came from posts by The Kobeissi Letter, citing Vortexa, Kpler, Energy Aspects, and the Wall Street Journal.
Nothing here substitutes for independent research; a chart pattern only describes probability, not certainty.
Expert Opinion
Market commentary around US Oil News this week leaned toward caution on the supply side.
Analysts tracking the diesel data called the combined 1.1 million barrel per day loss a genuine structural issue, not a temporary blip.
Whether the Iran ceasefire rejection turns into an actual bombing campaign after the midterms remains the open question shaping how far this triangle breakout could run.
Disclaimer: This article is for informational purposes only and does not constitute financial advice. Commodity markets, including crude oil, carry high volatility and can move sharply on geopolitical developments; prices can move against any projected level, and past performance offers no guarantee of future results. Readers should conduct independent research before making any investment decision.

















