Gram Price Prediction October 2026: TON Outlook and Key Levels


The Gram price prediction October 2026 is turning heads today. The token, previously known as Toncoin, is climbing after a bullish call from an X trader, and its daily chart sits at a critical moment.
Is this the start of something bigger or a setup that stalls before it starts? We break down the news, the data, and the levels that decide it.
Editorial disclosure: the CoinGabbar desk holds no personal position in $GRAM.
Gram Price Today: Live GRAM Price, Market Cap, and Volume Data
Price trades at $1.556,up 3.6% (+0.05407). Market cap is $4.43B. Futures volume is $101.99M against $29.85M in spot volume, about 3.4 times higher.
Open interest, the total value of unsettled futures contracts, is $213.01M, or 4.81% of market cap. Circulating supply is 2.68B GRAM out of a 5.19B total supply, about 51.64%.
Source: CoinGlass, Oct 2, 2026. The chart price of $1.556 comes from TradingView (Toobit, daily chart).
Gram News Today: Trader Breakout Call and What It Means for $GRAM
Don (@DonWedge) posted on X about 48 minutes ago that $GRAM has broken out from a diagonal resistance line and is only just getting started. 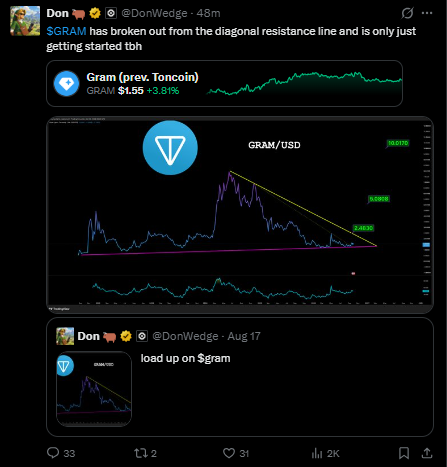
The post quotes his own call from Aug 17 telling followers to load up on $GRAM. This is one trader's opinion, not verified information.
The diagonal line it refers to sits on its own chart and is a different line from the trendline used in this article.
Why it matters: social media calls can draw attention and short-term buying, but they confirm nothing about price.
The post offers a chart and no other data, and the author's earlier bullish call adds a reason for caution. Treat it as a sentiment gauge, not a catalyst.
Gram Key Takeaways: $GRAM Setup, Support Levels, and Price Targets
$GRAM trades at $1.556 (1D, Toobit chart, Oct 2, 2026, 15:23 IST) and is bouncing off an ascending trendline.
Bullish trigger: daily close above $1.730 (+11.18%). Targets: $2.273 (+46.08%) and $2.909 (+86.95%).
Invalidation: daily close below $1.284 (-17.48%). The setup is void beneath it.
Futures volume is about 3.4 times spot volume, so derivatives activity shapes short-term moves.
The bullish call on X is an unverified opinion from one trader.
Gram Technical Analysis: GRAM Ascending Trendline Support Setup
Structure and trend. $GRAM has made higher lows along an ascending trendline since mid-September. In late September, the price spiked to $1.730 and was rejected, then pulled back to the trendline, which is now acting as support.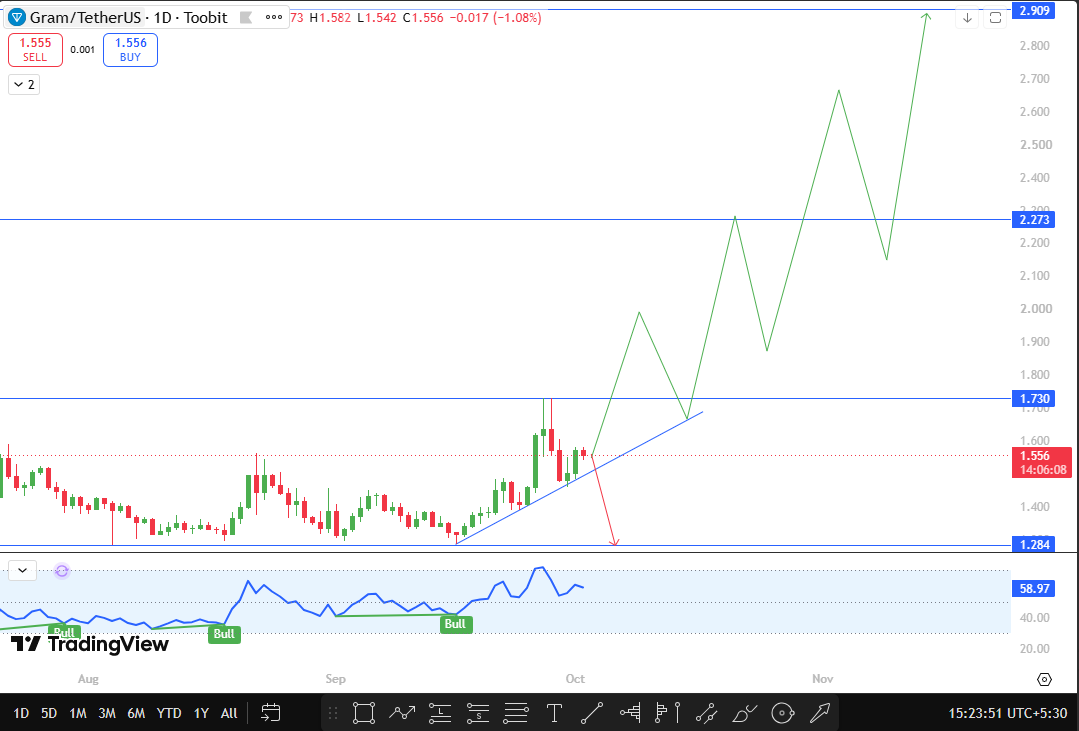
Pattern and breakout. The trendline is holding, but upside is not confirmed yet. $1.730, the late-September rejection high, is the level that matters. A daily close above it would clear the swing high and show buyers in control.
Targets. $2.273 is the first resistance on this setup, 46.08% above the current price, and a move that large needs follow-through across many daily candles. $2.909 is the major resistance, 86.95% away, and is a longer-term target.
Invalidation: $1.284 sits 17.48% below, near the lows of the recent range. A daily close beneath it would break the whole structure and void the setup. This analysis sets no downside target below it.
Momentum. The oscillator reads 58.97, above the midpoint but not stretched, so buyers lead without being overextended. Bull labels formed near earlier lows, including the mid-September low where the trendline begins.
Volume and open interest. Futures volume of $101.99M against $29.85M in spot volume means derivatives traders influence short-term moves. A breakout backed by spot buying is more reliable than one driven by futures alone.
Confirmation. Both levels need daily closes, not wicks.
GRAM Support and Resistance Levels: Gram Daily Price Target Zones
Level | Type | Importance | Distance From Current Price |
$2.909 | Major resistance | Final upside target | +86.95% |
$2.273 | Resistance | First upside target | +46.08% |
$1.730 | Breakout trigger | Late-September rejection high | +11.18% |
$1.556 | Current price | Trendline support test | 0% |
$1.284 | Invalidation | Close below voids the setup | -17.48% |
Gram Price Prediction Scenarios: Bullish, Base and Bearish GRAM
Bullish. Confirmation is a daily close above $1.730. Targets are $2.273, then $2.909. The scenario fails if the price closes back below $1.730 after confirming. A successful retest of $1.730 and rising spot volume strengthen it. A breakout on thin volume that reverses weakens it.
Base. Price stays between $1.284 and $1.730, a range of -17.48% to +11.18%, with the trendline continuing to hold. Confirmation is the absence of a daily close beyond either level, and there are no directional targets. A close outside the range ends it. Further bounces off the trendline strengthen it.
Bearish. Confirmation is a daily close below $1.284, which voids the setup. This analysis sets no downside target. The scenario fails if the price closes back above $1.284. A failed retest from below strengthens it, and a quick reclaim weakens it.
Market Context: $GRAM Derivatives, Leverage, and Liquidity
Futures trade about 3.4 times spot volume, and open interest equals 4.81% of market cap. Leverage can amplify moves, but because both triggers use daily closes, an intraday wick through a level confirms nothing. A trader's bullish call may add short-term attention, but the closes decide the setup.
Price Risks: Fake Breakout, Leverage, and News Uncertainty
A daily breakout can still fail and reverse within days. Leverage can cause liquidation wicks around both levels. The bullish call rests on one trader's opinion on X. A daily close below $1.284 invalidates the setup.
Conclusion: GRAM Triggers to Watch Next
This Gram price prediction depends on two daily closes. Above $1.730, the targets are $2.273 and $2.909. Below $1.284, the setup is void. Leverage and a single social media opinion are the main risks, and neither outcome is certain.
Disclaimer
This article is informational only and is not financial advice. Crypto is volatile, and you can lose your entire capital. Do your own research.












.webp)








