SUI Price Prediction: Can Golden Cross Send SUI 220% Higher?


One post says SUI will hit $55.09 before the year ends. SUI trades at $1.1807 today, so that call needs a move of more than 46 times.
Another post says a pattern that came before two jumps of roughly 220% is close to showing up again. This SUI price prediction checks what the chart actually shows.
SUI News: SUI $55.09 Before Year End?
Sui Intern posted that SUI will go to $55.09 before the year ends. The post also says "Sui Memes" will rise 30X from here. It gives no reasoning for either number.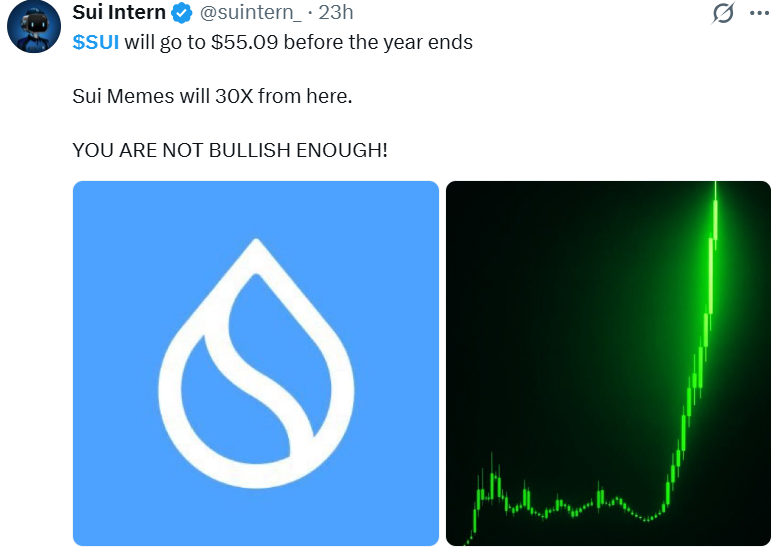
The highest level on the chart below is $3.00, so $55.09 sits far above anything the chart supports.
CoinGabbar could not independently verify these targets, and they are one account's opinion.
SUI Golden Cross Claim: Will the 50-Day EMA Cross the 200-Day?
Sui Insiders said SUI is on the brink of a Golden Cross. A Golden Cross happens when the 50-day moving average rises above the 200-day moving average.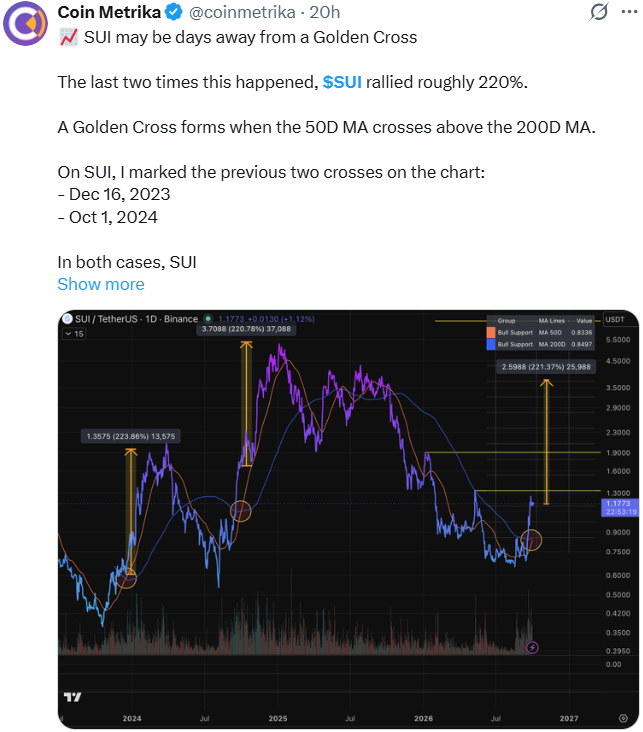
A moving average is the average closing price over a set number of days. Traders often read this cross as a sign of strengthening momentum.
The post says the two Ema lines were this close on December 16, 2023, and October 1, 2024, and that SUI rose about 220% each time. It adds that history may repeat if the cross happens in the next few days.
CoinGabbar could not verify these dates or gains. The chart below does not show a 50-day line. A Golden Cross also uses past prices, and a past pattern does not guarantee the same result.
SUI Price Today: Technical Analysis
SUI traded below $1.00 through August and early September. The price then jumped above the 200 EMA in mid-September and kept climbing.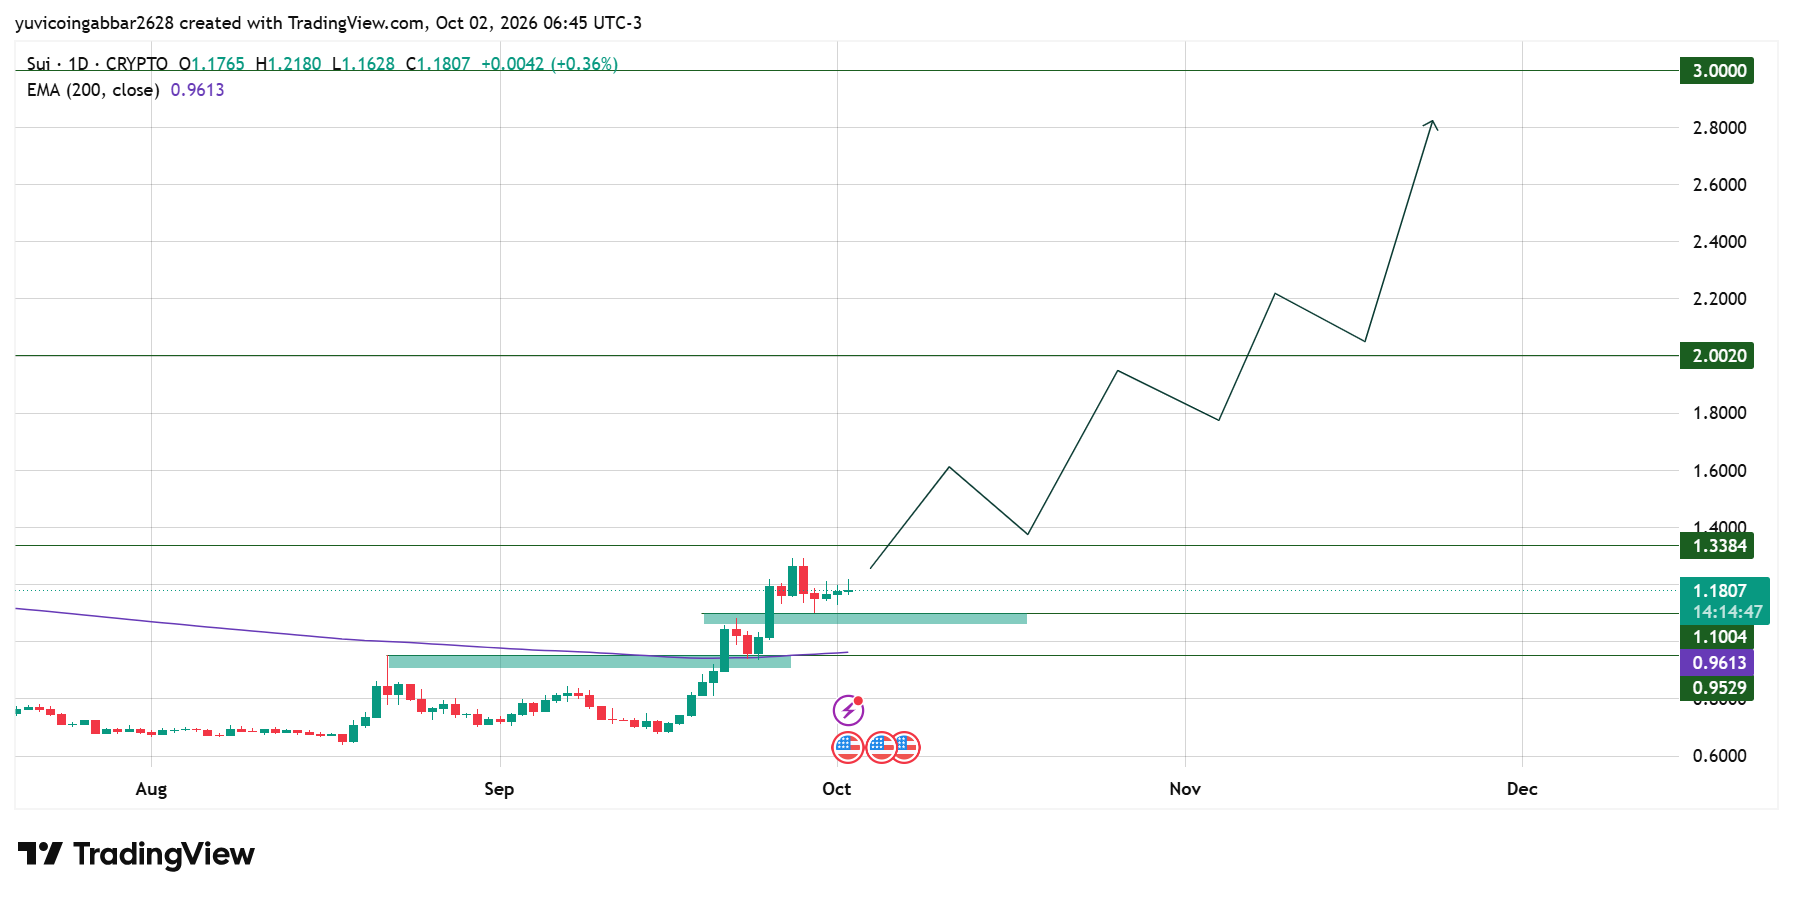
It peaked just under $1.3384, pulled back, and has held above the support zone near $1.1004 since.
An EMA (exponential moving average) gives more weight to recent prices. The 200 EMA at $0.9613 is a long-term average and is now below price, which is a better position than a few weeks ago.
SUI Forecast: Support and Resistance Levels
Level Type | Price |
Resistance 3 | $3.0000 |
Resistance 2 | $2.0020 |
Resistance 1 | $1.3384 |
Immediate Price Reference | $1.1807 |
First Confirmed Support | $1.1004 |
Deeper Support | $0.9529 |
SUI Outlook
Bull case: A daily close above $1.3384 would clear the level that capped the last push. The chart then points toward $2.0020.
Bear case: If SUI closes below $1.1004, the pullback would deepen. The next supports are the 200 EMA at $0.9613 and the green zone at $0.9529.
Can SUI Reach $3?
The $3.0000 level is the highest line on the chart. SUI would first need to close above $1.3384, then clear $2.0020.
Each step would have to hold on to a daily close. The chart's arrow path shows pullbacks along the way, so even the bullish route is not a straight line.
SUI Price Prediction: Expert View
According to CoinGabbar analysts, SUI has moved from below its 200 EMA to well above it, which is a clear change in momentum.
The next real test is $1.3384, because that level stopped the last advance. Until the price closes above it, the move is a recovery and not yet a breakout.
Disclaimer
This piece is for informational purposes only and isn't financial advice. The levels and scenarios above are based on technical chart analysis and publicly available data at the time of writing. Crypto markets can move sharply within hours, so past patterns don't guarantee future outcomes. Do your own research and consider your risk tolerance before acting on any level discussed here.












.webp)








