Toncoin Price Prediction September 2026: $GRAM Outlook

Toncoin launched in 2018 out of the original Telegram Open Network project and has since rebranded to Gram, now trading under the $GRAM ticker while keeping deep ties to the Telegram ecosystem.
$GRAM currently trades at $1.43, down 3.3% on the day.
Anyone running a Toncoin price prediction September 2026 search right now wants to know whether the descending triangle on the weekly chart breaks up or down from here.
Price Today: Live Data and 24-Hour Change (GRAM)
Metric | Value |
Price | $1.43 |
24H Change | -3.3% |
24H Range | $1.42 - $1.50 |
Market Cap | $3.958B |
Fully Diluted Valuation | $7.497B |
24H Trading Volume | $56.212M |
Circulating Supply | 2.765B |
Total Supply | 5.238B |
Max Supply | Infinite |
Source: Market data taken from Coingecko, data as of Aug 26, 2026 (UTC). Figures may vary slightly across other tracking websites.
Key Takeaways
$GRAM trades at $1.43, down 3.3% on the day, after a weekly candle that opened at $1.495 and closed at $1.440, down 4.89% for the week.
The weekly chart shows Toncoin still inside a descending triangle, with a flat support floor underneath and a falling trendline capping every bounce.
A break above the triangle's upper boundary on rising volume opens a path toward $2.264, then $2.815, and $3.574 further out.
A rejection from the upper boundary, followed by a break of the triangle's flat support, points toward $1.181 and then $0.582 as the next levels down.
Circulating supply sits at 2.765B against a total supply of 5.238B and an uncapped max supply, a dilution factor worth weighing against any bullish case in this Toncoin price prediction September 2026 setup.
Weekly Chart Analysis
Toncoin has been trading inside a descending triangle on the weekly chart, with a falling trendline connecting lower highs while a flat horizontal line holds as support underneath.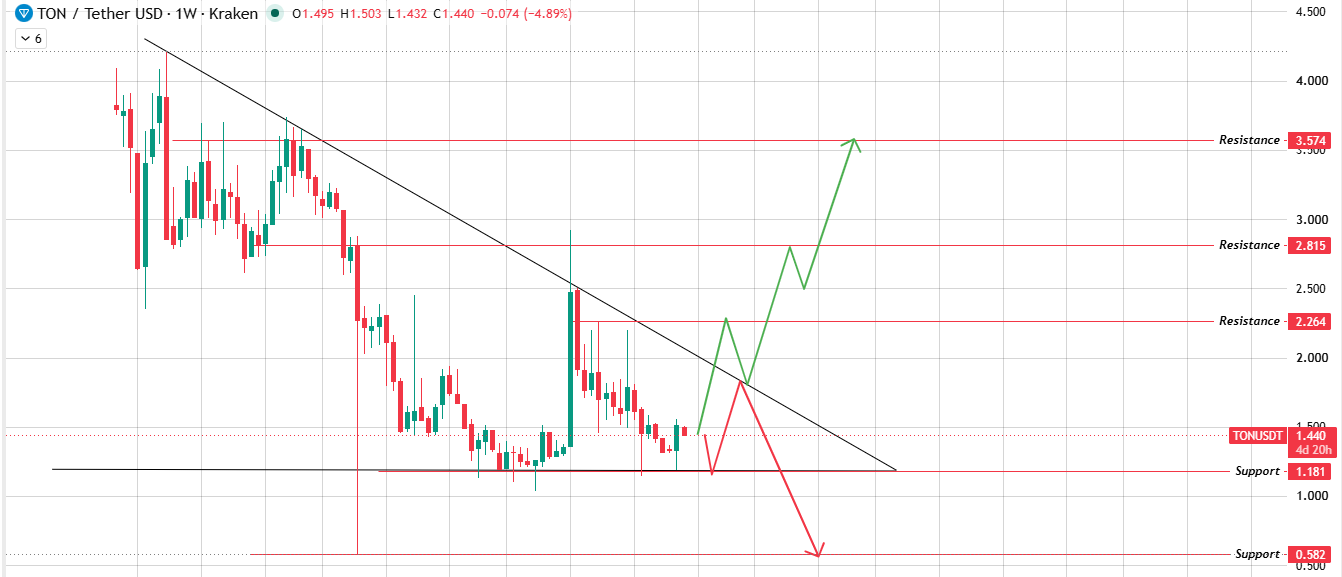
Source: Chart Taken From TradingView.
The setup here is straightforward: if the price pushes up and breaks the triangle's upper boundary with volume behind it, $GRAM has room to run toward $2.264, then $2.815, and eventually $3.574.
If instead the price gets rejected from that upper boundary and the flat support underneath gives way, the more likely path is a slide toward $1.181, with $0.582 as the level below that.
A breakout attempt that fails at the upper boundary on weak volume tends to just become another lower high inside the triangle, while a volume-backed break is what actually resolves the pattern in either direction.
Technical Analysis: Key Support and Resistance
Level Type | Price |
Resistance 3 | $3.574 |
Resistance 2 | $2.815 |
Resistance 1 | $2.264 |
Support 1 | $1.181 |
Support 2 | $0.582 |
Toncoin Price Prediction September 2026: Bull, Base, and Bear Case
Scenario | Level | Setup | Invalidation |
Bull | $2.264 - $3.574 | $GRAM breaks above the descending triangle's upper boundary on rising volume, holds the breakout on a weekly retest, and pushes through $2.264 and $2.815 toward $3.574. | Weekly close back inside the triangle after the breakout |
Base | $1.181 - $2.264 | $GRAM stays inside the triangle, holding above the flat support but unable to clear the upper boundary with conviction, chopping while volume stays light. | Extended consolidation without a confirmed break of either boundary |
Bear | $0.582 - $1.181 | The triangle's flat support breaks, the descending structure holds, and the price grinds down toward $1.181, then $0.582. | Reclaim and hold above the triangle's flat support. |
On-Chain and Fundamental Drivers (GRAM)
$GRAM's market cap of $3.958B sits well below its fully diluted valuation of $7.497B, a gap driven by roughly 2.473B tokens still outside circulation out of a 5.238B total supply.
With max supply uncapped, ongoing token issuance is a real headwind for this Toncoin price prediction September 2026 view.
Daily trading volume of $56.212M relative to market cap suggests reasonable liquidity, enough to support a breakout if risk appetite returns.
Treasury holdings of over 232 million tokens add another layer of potential future supply.
September Catalysts That Could Move the Price (GRAM)
Telegram ecosystem activity remains the single biggest driver for $GRAM, given how tightly the network is tied to Telegram's user base and mini app rollout.
Broader altcoin rotation matters too; when capital moves into large-cap layer ones, $GRAM tends to catch a share of that flow.
Bitcoin and Ethereum price direction sets the ceiling for how far $GRAM can realistically run in a given month.
What Analysts Are Forecasting (GRAM)
Price target estimates for this Toncoin price prediction September 2026 vary widely depending on the source, with no strong consensus on a single September number across trackers.
The more reliable approach is to treat the technical levels above as the actual forecast: the triangle's upper boundary is the level bulls need to clear with volume, and the flat support underneath is the level bears need to break for the downtrend to extend toward $0.582.
Risks That Could Invalidate This Forecast (GRAM)
This entire technical picture rests on how $GRAM behaves at the descending triangle's upper boundary and its flat support floor.
A rejection at the upper boundary keeps the multi-month downtrend intact and points back toward the flat support first, then lower levels if that breaks too.
Beyond the chart, uncapped max supply and any slowdown in Telegram-related activity would weigh on this setup regardless of technical positioning.
How to Buy and Store It Safely (GRAM)
$GRAM trades on most major centralized exchanges and through decentralized exchanges paired against major stablecoins.
Stick to platforms with deep order books, since thinner liquidity spots see wider slippage during volatile weekly candles.
Small amounts are fine on an exchange, but larger holdings belong on a hardware wallet like a Ledger or Trezor.
Disclaimer: This article is for informational purposes only and does not constitute financial advice. Cryptocurrency markets are highly volatile, and prices can move sharply in either direction without warning. Always do independent research and consult a licensed financial advisor before making investment decisions.

















