Harmony Price Prediction ONE October 2026: Breakout or Breakdown?

Harmony's native token, ONE, enters October 2026 mid-way through one of its wildest weeks on record. A single-day gain past 80% turned a quiet chart into a talking point. For the longer view, a detailed Harmony price prediction covering 2026 through 2030 lays out the multi-year picture. This piece stays narrow: October only, using the snapshot below. Can the move hold?
Quick Prediction Box
(Data captured 16:00 UTC, September 20, 2026)
Metric | October 2026 Snapshot |
Current ONE Price | $0.004360 |
24H Change | +82.08% |
7D Change | +577.11% |
Market Cap | $65.53 million |
Trading Volume (24H) | $238.15 million |
Trend | Bullish, but stretched |
October Target (Bull Case) | $0.0080 – $0.0126 |
Key Support | $0.00198 zone |
Key Resistance | $0.0052 – $0.0064 zone |
RSI (14, Daily) | 96.02 |
MACD | Positive, widening |
Bull Case | $0.0080 – $0.0126 |
Base Case | $0.0030 – $0.0052 |
Bear Case | $0.0015 – $0.0022 |
Invalidation | Loss of $0.00198 support |
Harmony Price Prediction October 2026
The direct answer: the base case points to $0.0030 to $0.0052. A realistic bull case stretches to $0.0080 to $0.0126 if volume keeps confirming the breakout. A bear case near $0.0015 to $0.0022 stays live if momentum fades.
Harmony just broke a long descending channel on the daily chart, and September momentum carried that break into October on volume nobody priced in a month earlier. Turns out, the support and resistance map is unusually clean for a token this size, based on live Harmony market data.
October Scenario | ONE Price Range | Conditions | Invalidation |
Bear Case | $0.0015 – $0.0022 | Support breaks + selling volume | Reclaim of $0.00198 |
Base Case | $0.0030 – $0.0052 | Consolidation + stable volume | Breakdown below $0.00198 |
Bull Case | $0.0080 – $0.0126 | Resistance breakout + rising volume | Failed breakout at $0.0052 |
None of these ranges is a guarantee. The bull figure is a scenario, not a promise.
Harmony ONE Price Today and Market Snapshot
ONE Price, Market Cap and Trading Volume
As of 16:00 UTC on September 20, 2026, ONE traded near $0.004360. Market cap sat near $65.53 million, matching fully diluted value since Harmony carries no maximum supply cap.
Volume over 24 hours reached $238.15 million, a volume-to-market-cap ratio above 350%. Circulating supply, checked against the Harmony blockchain explorer, stands at 15.02 billion ONE. The 24-hour range ran $0.00222 to $0.0051; the seven-day range stretched from near $0.0006 up to that same high.
ONE 24H and 7D Performance
So is this a sustained trend, a recovery, or just a speculative spike? A seven-day gain near 577% isn't something a healthy market produces on fundamentals alone, and a move this fast usually carries a catalyst or a short squeeze underneath it. For more on whether the run continues, a separate breakout or downtrend reversal analysis digs deeper. Here's the thing: volume rose alongside price, not after it, the difference between a pump that fades and one that holds.
Harmony Technical Analysis for October 2026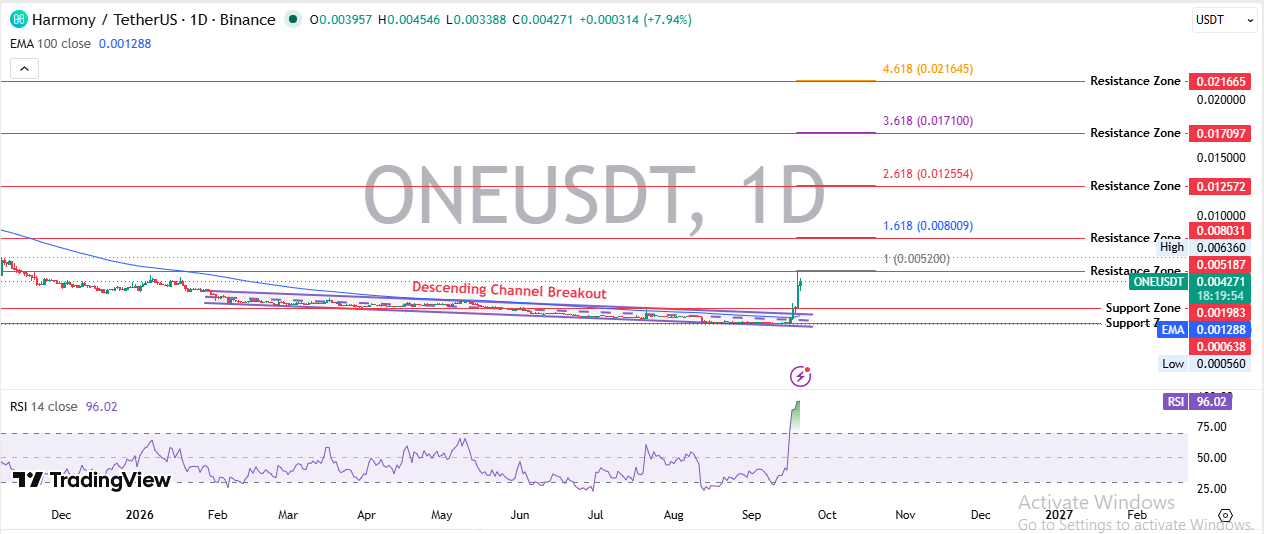
ONE Support Levels
Near-term support sits at $0.00198, the top of the old descending channel, now flipped into support, with prior tests on thin volume. A deeper zone sits near $0.00064, tied to August's panic low.
The 100-day EMA (a trend line built from the last hundred trading days) sits near $0.00129, far under current trading. Prices running this far above its own trend line rarely lasts long.
ONE Resistance Levels
Immediate resistance sits between $0.0052 and $0.0064, where the rally already stalled once. Major resistance sits near $0.0080, a Fibonacci extension visible on a live Harmony trading chart. The breakout level that changes the conversation sits near $0.0126, where each zone marks a point where earlier buyers or sellers already made decisions.
RSI and MACD Signals
RSI (a momentum gauge from zero to a hundred) reads 96.02 daily. That's not just overbought. That's about as stretched as it gets. RSI above 70 usually flags strong but overheating momentum; near 96, a cooldown gets more likely by the day. MACD (built from two moving averages) shows the line, signal, and histogram all positive and widening, a genuinely bullish reading.
But an RSI this extreme rarely lines up cleanly with a fresh bullish MACD. One signals caution. The other confirms the trend.
Trading Volume and Breakout Confirmation
Breakout plus rising volume equals stronger confirmation; breakout plus falling volume equals higher false-breakout risk. Current volume dwarfs anything Harmony saw earlier in the month, and futures data from a liquidation and volume dashboard shows derivatives activity spiking alongside spot volume.
When we lined up volume against price, what stood out wasn't the spike. It was how early volume arrived, hours before the biggest candle formed.
Harmony October 2026 Bull, Base and Bear Scenarios
Scenario | October Range | Required Conditions | Invalidation |
Bear | $0.0015 – $0.0022 | Support breaks, selling volume rises | Support reclaimed |
Base | $0.0030 – $0.0052 | Consolidation above support | Support lost |
Bull | $0.0080 – $0.0126 | Resistance breaks, volume expands | Breakout fails |
Bull case: a clean break above $0.0052 on strong volume opens the door toward $0.0080, then $0.0126, if new buyers keep showing up.
Base case: support holds, volatility cools, and ONE consolidates in range. Fine. That's the least dramatic outcome and statistically the most common after a move this size.
Bear case: $0.00198 gives way under selling pressure, and the price retests the lower zone. Nobody wants this outcome. But it's on the table.
What Could Move Harmony Price in October 2026?
Ethereum Migration
Harmony's biggest fundamental story isn't the chart. It's a proposed shift away from its independent Layer 1 (a standalone blockchain settling its own transactions) toward an Ethereum-based token model. Successful execution could open deeper liquidity and rebuild confidence, feeding demand. But delays or unclear conversion terms could do the opposite. Don't assume migration automatically creates upside; it creates a variable, and variables cut both ways.
Harmony's AI Video Pivot
Alongside migration talk, Harmony has floated an AI-video initiative as a new utility thesis. Adoption could feed token demand; coverage across AI-focused crypto news treats the pivot cautiously. Weak adoption would leave it a narrative with no teeth.
Bitcoin and the Broader Crypto Market
Bitcoin traded near $80,456 at this snapshot, down about 0.7%, with the market cap near $1.61 trillion, also down slightly. That's a flat-to-soft backdrop, not a rally lifting everything along with it. It means Harmony's spike looks idiosyncratic. Broader risk appetite, visible across altcoin flows and speculative memecoin activity, stayed muted while ONE screamed higher alone. And that gap is worth sitting with.
Can Harmony ONE Reach $0.01?
Possible. Not close. Not guaranteed.
Required market cap: with circulating supply near 15.02 billion ONE, $0.01 implies a market cap near $150 million.
Required increase: from $0.004360, that needs a gain near 129%.
Conditions: successful migration, deeper liquidity, sustained demand, real ecosystem utility, and a friendly broader market.
Obstacles: the August security history, supply uncertainty, migration execution risk, thin off-peak liquidity, and adoption still unproven.
Invalidation: a failed migration, a fresh exploit, or a market downturn would each weaken the thesis alone.
Basically, breaking $0.0052 fixes nothing by itself. For the longer horizon, a dedicated price prediction resource breaks down multi-year targets.
Harmony Price Prediction Risks
In order of relevance: migration execution risk, security risk, supply changes, liquidity risk, failed breakout, low-volume rally risk, Bitcoin weakness, a broader correction, adoption risk, development activity, AI-video execution risk, and regulatory risk.
The security issue deserves plain language: Harmony's 2026 exploit is independently reported, and on-chain data shows meaningful concentration, with the largest tracked address holding around 40% of circulating supply. That's a real overhang, not a footnote. Fine. None of it disappears just because the chart looks good this week. Any hint of new airdrop programs tied to the migration could shift short-term demand fast.
What Traders Should Watch Next
If ONE Breaks Above Resistance
A trade above $0.0052 holding on rising volume opens the path toward $0.0080. RSI needs room to reset toward 50–60 for the move to hold. Losing $0.0052 again fast would invalidate it.
If ONE Falls Below Support
Losing $0.00198 on rising volume points toward $0.0015. A fading MACD histogram would confirm it, and a trade back above $0.00198 is the bearish invalidation.
Volume and RSI
Is the move attracting enough volume to sustain it? So far, yes, though whether that holds into October is the real question. Momentum, at an RSI of 96.02, is already overheated. The next move is usually a cooldown, not a collapse.
Migration News
Watch official migration updates alongside an exchange listing tracker and a broader crypto events calendar.
Security and Bitcoin
Monitor wallet movements tied to the exploit, exchange activity, and official statements; new unauthorized activity would hit confidence immediately. Bitcoin holding steady would remove downside pressure on ONE, while further Bitcoin weakness would make the rally harder to defend.
Disclaimer
This article is for informational purposes only and does not constitute financial, investment, or trading advice. Cryptocurrency prices, including Harmony ONE, are highly volatile and can change significantly within short periods. Figures referenced here reflect a snapshot taken at 16:00 UTC on September 20, 2026, and may not represent current market conditions. Anyone considering a position in ONE or any other digital asset should conduct independent research and consult a qualified financial advisor before making decisions.


















