Shiba Inu Price Prediction: Can This Level Unlock the Next Rally?


Shiba Inu has spent much of 2026 chasing a single goal among its holders: shedding a zero from its price tag.
This Shiba Inu price prediction looks at whether the token's current setup can finally push that goal within reach, or whether a familiar barrier holds it back once again.
A rare weekly signal has renewed that conversation, and traders are now watching a specific level on the shorter-term chart to see which direction takes over.
Shiba Inu launched in August 2020 as an Ethereum-based meme token and has since built out its own ecosystem, including the Shibarium layer-2 network and the Shib burn mechanism.
The Shiba Inu price today is $0.00000539, down roughly 0.4% over the past 24 hours, with a market capitalization of $3.178 billion.
Its fully diluted valuation sits close to that figure at $3.18 billion, reflecting how much of its total supply is already in circulation.
Live Market Data
Metric | Value |
Price | $0.00000539 |
24H Change | -0.4% |
24H Range | $0.00000533 - $0.00000568 |
Market Cap | $3.178B |
Fully Diluted Valuation | $3.18B |
24H Trading Volume | $93.45M |
Circulating Supply | 589.239T |
Total Supply | 589.496T |
Source: market data taken from CoinGecko, as of Sep 20, 2026. Figures may vary slightly across other tracking websites.
SHIB Exchange Volume
Futures trading activity for shiba inu coin remains concentrated on a handful of platforms. OKX leads with $19.10 million in 24-hour volume, closely followed by LBank at $18.00 million. 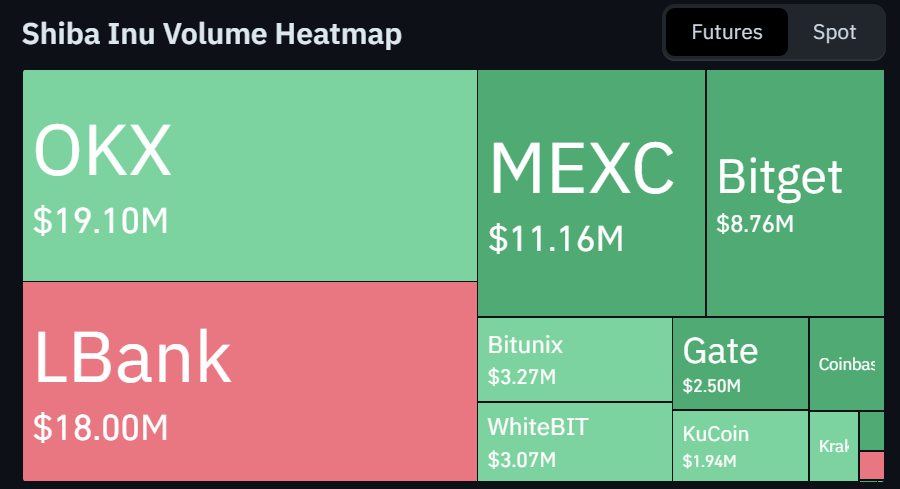
Source: Volume Heatmap Data Taken From CoinGlass, As of Sept 20, 2026.
MEXC processed $11.16 million, while Bitget recorded $8.76 million over the same period. Smaller contributions came from Bitunix at $3.27 million, WhiteBIT at $3.07 million, Gate at $2.50 million, and KuCoin at $1.94 million.
The spread across multiple exchanges suggests trading interest is broad rather than concentrated on a single venue, which typically supports more stable price discovery.
Shiba Inu News Today
Shiba Inu news has centered on a technical pattern rather than fundamentals. U.Today reported that Shiba Inu has formed a rare weekly "Bull Combo" setup, a signal some traders associate with the early stages of an upward trend reversal. 
Source: Data Taken From @Utoday_en, X Account, as of Sep 20, 2026
The outlet noted, however, that a significant chart barrier still sits above current levels, meaning the pattern alone does not guarantee an immediate move toward eliminating a zero from SHIB's price.
This kind of weekly signal tends to play out over weeks rather than days, so its confirmation depends heavily on how price behaves at the resistance zones outlined below.
Shiba Inu Technical Analysis
On the 4-hour chart, tracked against Binance data with candles closing at 11:40 UTC+5:30 on September 20, 2026, $SHIB is trading inside an ascending channel.
Price currently sits near the lower boundary of that channel at $0.00000539, following a pullback from recent highs. 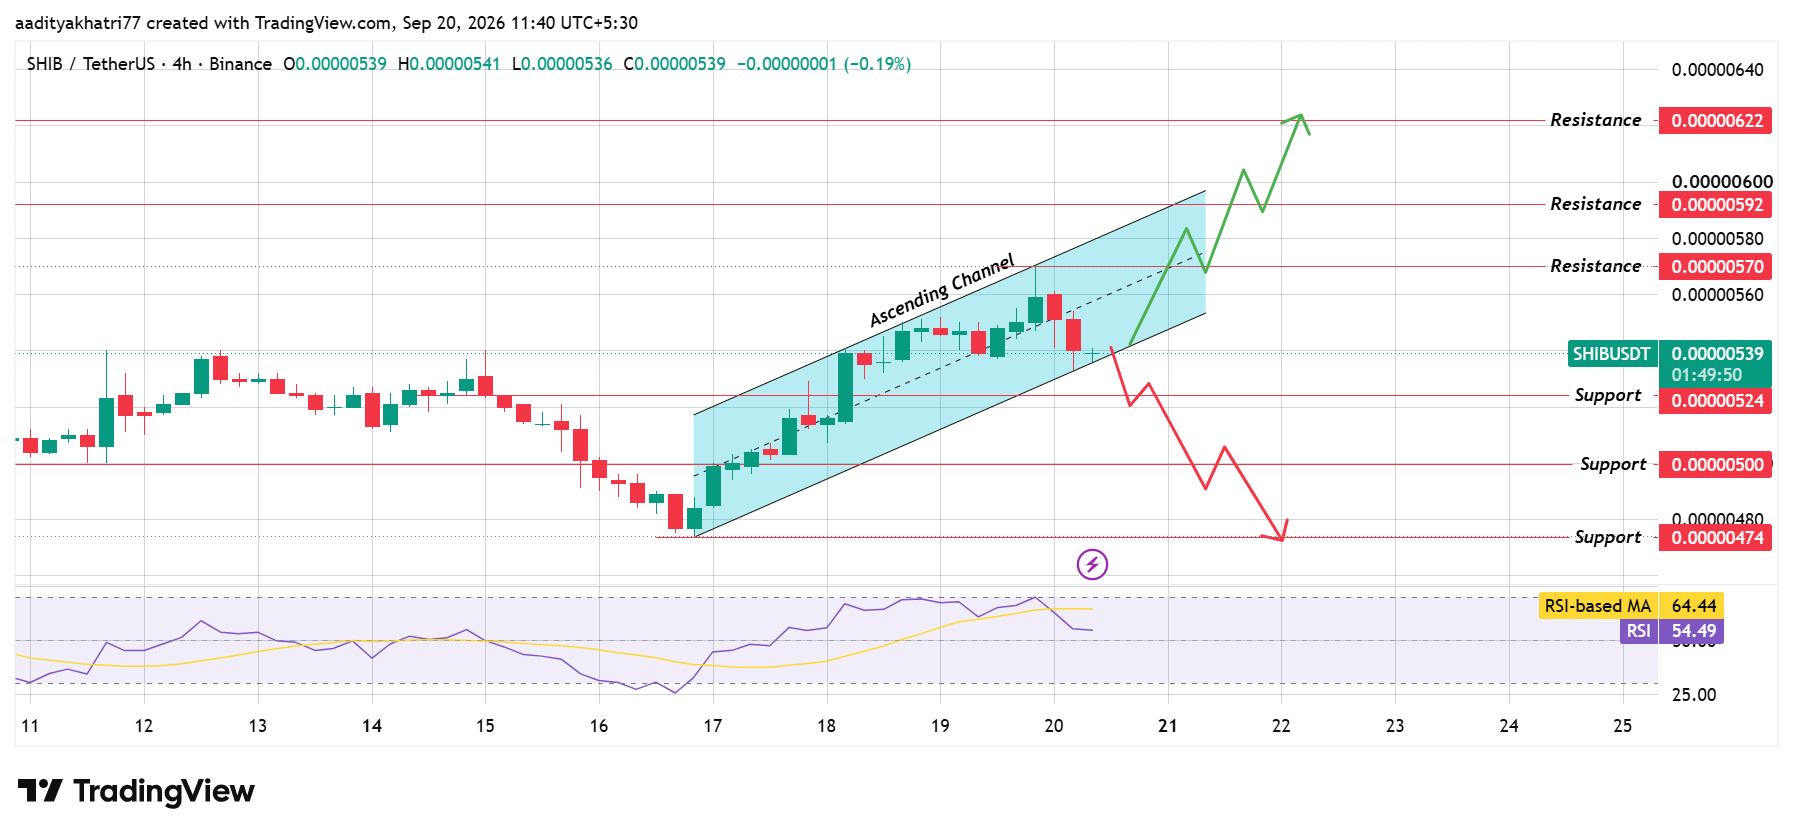
Source: Chart taken from TradingView, as of Sep 20, 2026
The Relative Strength Index reads 54.49, with its moving average at 64.44, suggesting momentum has cooled from overbought territory but has not turned decisively bearish.
This Shiba Inu technical analysis treats the channel boundary as the key decision point for the next leg.
Can $SHIB Bounce Off Support and Break Higher?
If price holds the lower boundary of the ascending channel and buyers step in with rising volume, $SHIB could push back toward the upper boundary of the channel.
A confirmed 4-hour candle close above $0.00000570 with above-average volume would open the path toward $0.00000592 and ultimately the $0.00000622 resistance zone.
This scenario would align with the weekly Bull Combo signal reported by U.Today, giving the setup added weight if both timeframes confirm together.
What Happens If the Channel Support Breaks?
A breakdown below the lower boundary of the ascending channel would shift the outlook.
A confirmed close under $0.00000524 with sustained selling volume could send the price toward $0.00000500, and a deeper move would target the $0.00000474 support zone.
This would likely delay the zero-deletion narrative and put the weekly bullish signal on hold until price reclaims the channel.
$SHIB Support and Resistance Levels
Support | Resistance |
$0.00000524 | $0.00000570 |
$0.00000500 | $0.00000592 |
$0.00000474 | $0.00000622 |
Bull, Base, and Bear Scenarios
Scenario | Setup | Level |
Bull | Channel support holds, breakout above upper boundary | $0.00000622 |
Base | Price consolidates within the ascending channel | $0.00000539 - $0.00000570 |
Bear | Channel support breaks on rising volume. | $0.00000474 |
SHIB vs Bitcoin
Shiba Inu's price action continues to track Bitcoin's broader trend, a pattern common among mid-cap altcoins.
When Bitcoin holds firm above its own key support zones, capital tends to rotate into tokens like SHIB, amplifying moves in both directions.
The current channel test on the $SHIB chart is unfolding while Bitcoin trades in a relatively stable range, which has kept $SHIB's volatility contained rather than sharply directional.
A meaningful shift in Bitcoin's trend would likely accelerate whichever scenario plays out on the SHIB chart, given how closely altcoin liquidity follows the market leader.
Expert Opinion
Market commentary following the weekly Bull Combo report has been cautiously optimistic.
Analysts tracking Shiba Inu note that while the weekly signal is statistically rare and has preceded meaningful rallies in the past, short-term charts like the 4-hour timeframe often need their own confirmation before the larger move materializes.
The consensus view is that SHIB's next few candles at the channel boundary will likely determine whether the weekly signal gains traction or stalls against overhead resistance.
Disclaimer: This article is for informational purposes only and does not constitute financial advice. Cryptocurrency prices are highly volatile, and Shiba Inu could move in either direction regardless of the scenarios outlined above. Actual price movement may fall short of, or exceed, the levels discussed, and downside risk should be weighed carefully before making any investment decision.


















