Hyperliquid Price Prediction: Bounce to $89.953 or Drop to $81.251?


Longs made up about 93% of the $1.83 million in HYPE liquidations on Hyperliquid over the past 24 hours.
That imbalance shapes this Hyperliquid price prediction October 2026, because it shows which side got caught as the price fell.
Hyperliquid is a decentralized exchange focused on perpetual futures, built on its own layer-1 blockchain. HYPE is its native token.
The Hyperliquid price today is $86.60, down 1.8% in the last 24 hours, with a market cap of about $19.261 billion.
That ranks Hyperliquid #11 among all cryptocurrencies. And this Hyperliquid Price Prediction reviews market data, trading activity, and the outlook for October.
Live HYPE Market Data
| Metric | Value |
| Price | $86.60 |
| 24H Change | -1.8% |
| 24H Range | $84.94 - $89.00 |
| Market Cap | $19.261B |
Source: market data taken from CoinGecko, as of Sep 30, 2026. Figures may vary slightly across other tracking websites.
The fully diluted valuation of $82.717B is about 4.3 times the market cap. That gap means many tokens have not reached circulation, so future supply can weigh on price.
Trading volume of $665.916M equals about 3.5% of the market cap. The token trades actively, and HYPE is down about 1.3% against Bitcoin over the same 24 hours.
Hyperliquid Volume and Liquidation Data
The volume heatmap shows 24-hour HYPE trading volume by exchange. Binance leads with $585.14M, followed by LBank at $426.40M and Hyperliquid itself at $422.32M. OKX, Bybit, and WhiteBIT come next with $178.63M, $175.38M, and $150.35M.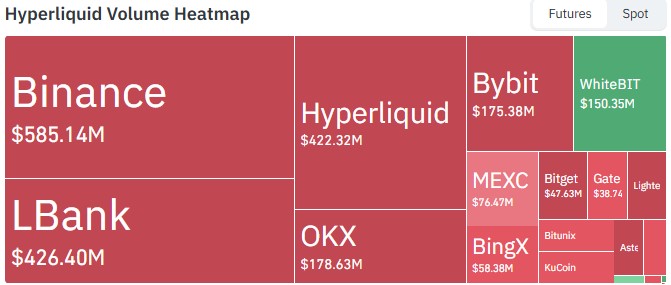
Source: Data taken from CoinGlass , as of Sep 30, 2026
Trading is spread across many venues, and no single exchange dominates. Hyperliquid's own platform ranks third.
Liquidations on Hyperliquid reached $1.83M over 24 hours. Long positions made up $1.71M of that, about 93%, while short positions made up $113.04K. Over the last 12 hours, Longs accounted for $312.45K of $339.12K.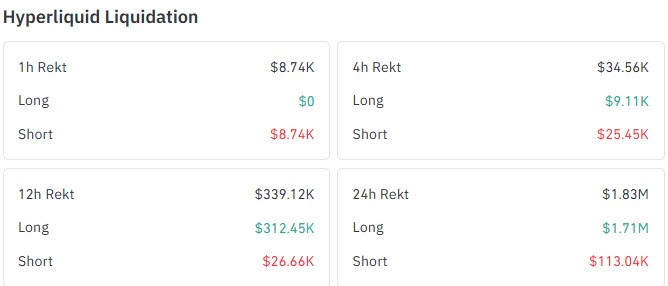
Source: Liquidation data taken from CoinGlass , as of Sep 30, 2026
The recent hours look different. Over the last 4 hours, short liquidations of $25.45K exceeded longs at $9.11K, and the last hour recorded only $8.74K in shorts.
This fits the pattern of the drop, with longs forced out during the fall and shorts squeezed on the small bounce.
These amounts are tiny next to the $665.916M daily volume. Liquidations alone are not driving the move.
Hyperliquid Technical Analysis
This Hyperliquid technical analysis uses the 4-hour HYPEUSDT chart from OKX, viewed on Sep 30, 2026, at 15:08 IST (UTC+5:30).
In this timeframe, HYPE has formed a head and shoulders pattern. The left shoulder peaked near $94.5 on September 19, and the head followed near $98.2 on September 23.
The right shoulder reached $94.5 again on September 27. The neckline sits near $89.7.
The price broke below the neckline on September 28 and has since fallen to the $85 area. 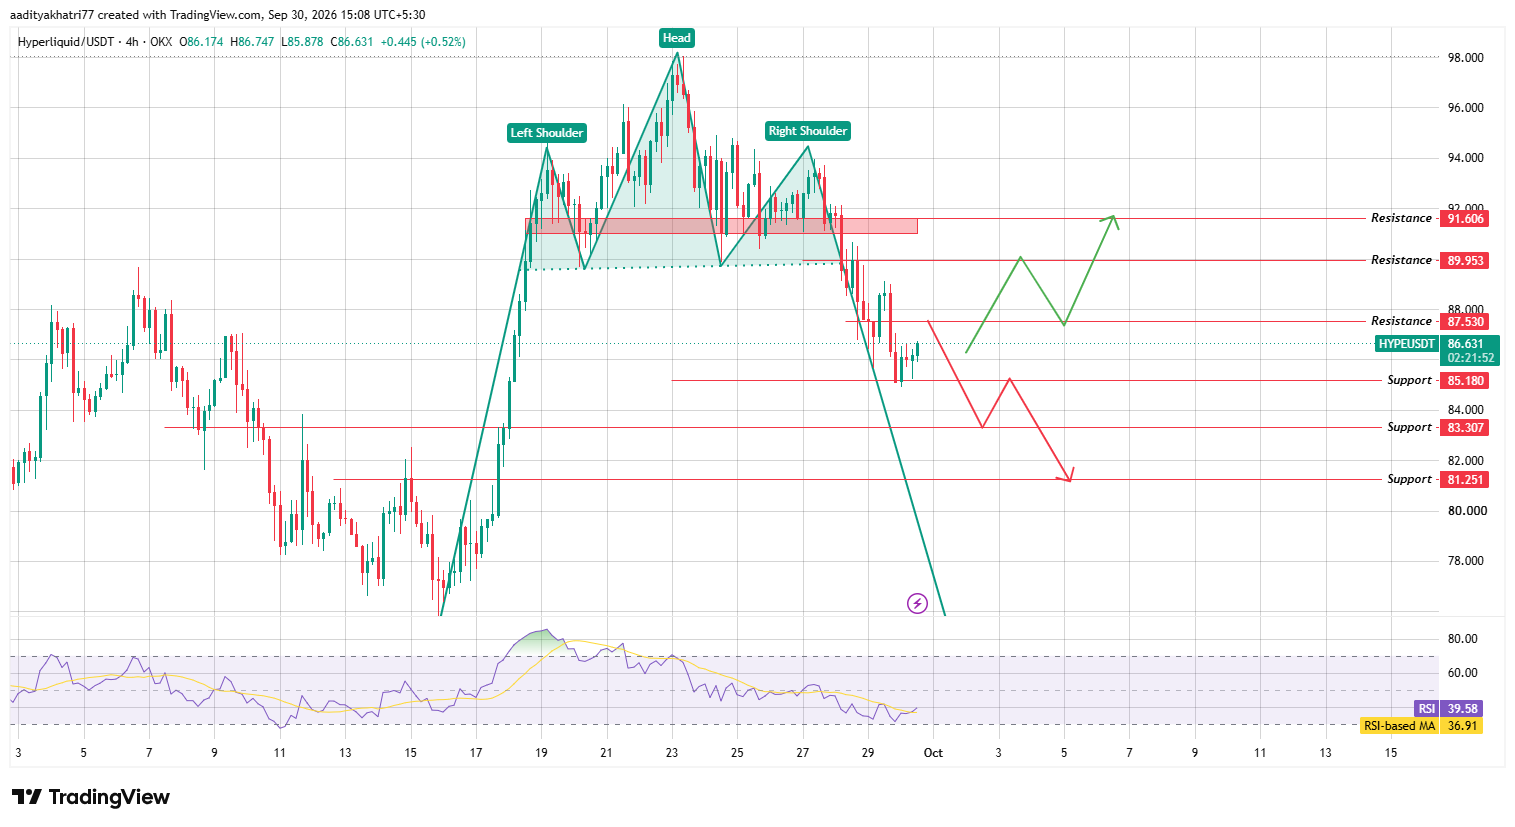
Source: Chart taken from TradingView , OKX HYPEUSDT 4-hour price, as of Sep 30, 2026, 15:08 IST
The 24-hour low near $84.94 briefly dipped under the $85.180 support before the price recovered.
The latest 4-hour candle trades at $86.631, above that support and below the $87.530 resistance.
The head rises about $8.5 above the neckline. Measured down from the neckline, that points to roughly $81.2, which matches the $81.251 support.
RSI reads 39.58 and sits just above its moving average of 36.91. It remains under the 50 midline, so momentum is still bearish, although the small cross above the average hints at a pause in selling.
Can HYPE Reclaim The Neckline?
The bullish case starts with a hold above the $85.180 support. If buyers defend it, the price can bounce toward the $87.530 resistance.
A 4-hour candle close above $87.530 would be the first sign of strength. Volume should also exceed the average of the previous 20 candles.
The next resistance sits at $89.953, which is close to the neckline, followed by $91.606.
The green path on the chart shows a rally to $89.953, a pullback to $87.530, and a second push toward $91.606. A rally to the neckline is a retest and not yet a reversal.
A close above $91.606 would weaken the bearish setup, and full invalidation needs a move above the right shoulder near $94.5
What Happens If HYPE Breaks Support?
The bearish case begins with rejection at the $87.530 resistance. A 4-hour close below the $85.180 support would confirm that sellers remain in control.
The first target is $83.307, and the next is $81.251, which also matches the pattern's measured move. The red path on the chart shows a weak bounce back toward $85.180 before the final leg lower.
Hyperliquid Price Levels to Watch
These hyperliquid price levels come from the zones marked on the 4-hour chart.
| Support | Resistance |
| $85.180 | $87.530 |
| $83.307 | $89.953 |
| $81.251 | $91.606 |
Hyperliquid Price Prediction: Bull, Base, and Bear Scenarios
| Scenario | Setup | Level |
| Bull | 4-hour close above $87.530, then a retest of the neckline zone | $89.953 to $91.606 |
| Base | Range trade between support and resistance | $85.180 to $87.530 |
| Bear | 4-hour close below $85.180 | $83.307 to $81.251 |
Hyperliquid vs Bitcoin
Bitcoin usually sets the tone for large altcoins such as HYPE. A steady Bitcoin market gives a relief rally room to develop.
A sharp Bitcoin drop can push HYPE through support no matter what its own chart shows.
The market data shows HYPE down about 1.3% against Bitcoin over the past 24 hours. That means it is lagging the market leader for now.
Methodology
This Hyperliquid price prediction 2026 update uses the 4-hour HYPEUSDT chart from OKX on TradingView. The head and shoulders points, RSI, and the RSI-based moving average were read candle by candle.
The neckline and peak values quoted in the text are approximate readings from the chart.
Support and resistance levels come directly from the zones marked on that chart. Price, market cap, and volume figures come from a CoinGecko snapshot.
The exchange volume and liquidation figures come from tracker screenshots, dated Sep 30, 2026, and they were not used to set any level.
Nothing here replaces independent research. A chart pattern describes probability, not certainty, and a 4-hour setup can change within a few candles.
Expert Opinion
Taken together, the chart supports a cautious Hyperliquid price forecast for October, while HYPE trades below the neckline near $89.7. The neckline break and RSI under 50 both point lower.
Still, price defended the $85 area, and the liquidation data shows longs have already been cleared.
A confirmed 4-hour close above $87.530 would favor buyers, while a close below $85.180 would favor sellers. This is general market commentary, not a guarantee of direction.
Disclaimer: This article is for informational purposes only and does not constitute financial advice. Cryptocurrency markets, including Hyperliquid, carry high volatility and downside risk; prices can move sharply against any projected level, and past performance offers no guarantee of future results. Readers should conduct independent research before making any investment decision.











.webp)










