Hedera Price Prediction: BlackRock Analyst Eyes Parabolic HBAR Move?


A former top BlackRock analyst says a parabolic HBAR move is "inevitable," with targets running as high as $4.11, right as HBAR posts a sharp recovery on the chart.
This Hedera Price Prediction checks that claim against what the chart actually shows, starting with the $0.10026 level.
Hedera News: Analyst Says a Parabolic Move Is "Inevitable"
A social media post from Steph Is Crypto said a former top BlackRock analyst believes a parabolic HBAR move is inevitable, with targets of $0.50, then $1.27, then $4.11, and that the move is expected to start soon.
The post didn't name the analyst, link to the original comments, or explain the reasoning behind the targets. For context, the highest level actually marked on the chart below is $0.20013, well below even the first target cited.
CoinGabbar could not independently verify who made this claim or what it's based on, so it should be treated as an unverified secondhand claim rather than a confirmed analysis.
Hedera Price Today: Technical Analysis
HBAR spent April through August in a long, slow decline, falling from around $0.13 to a low near $0.07 by August.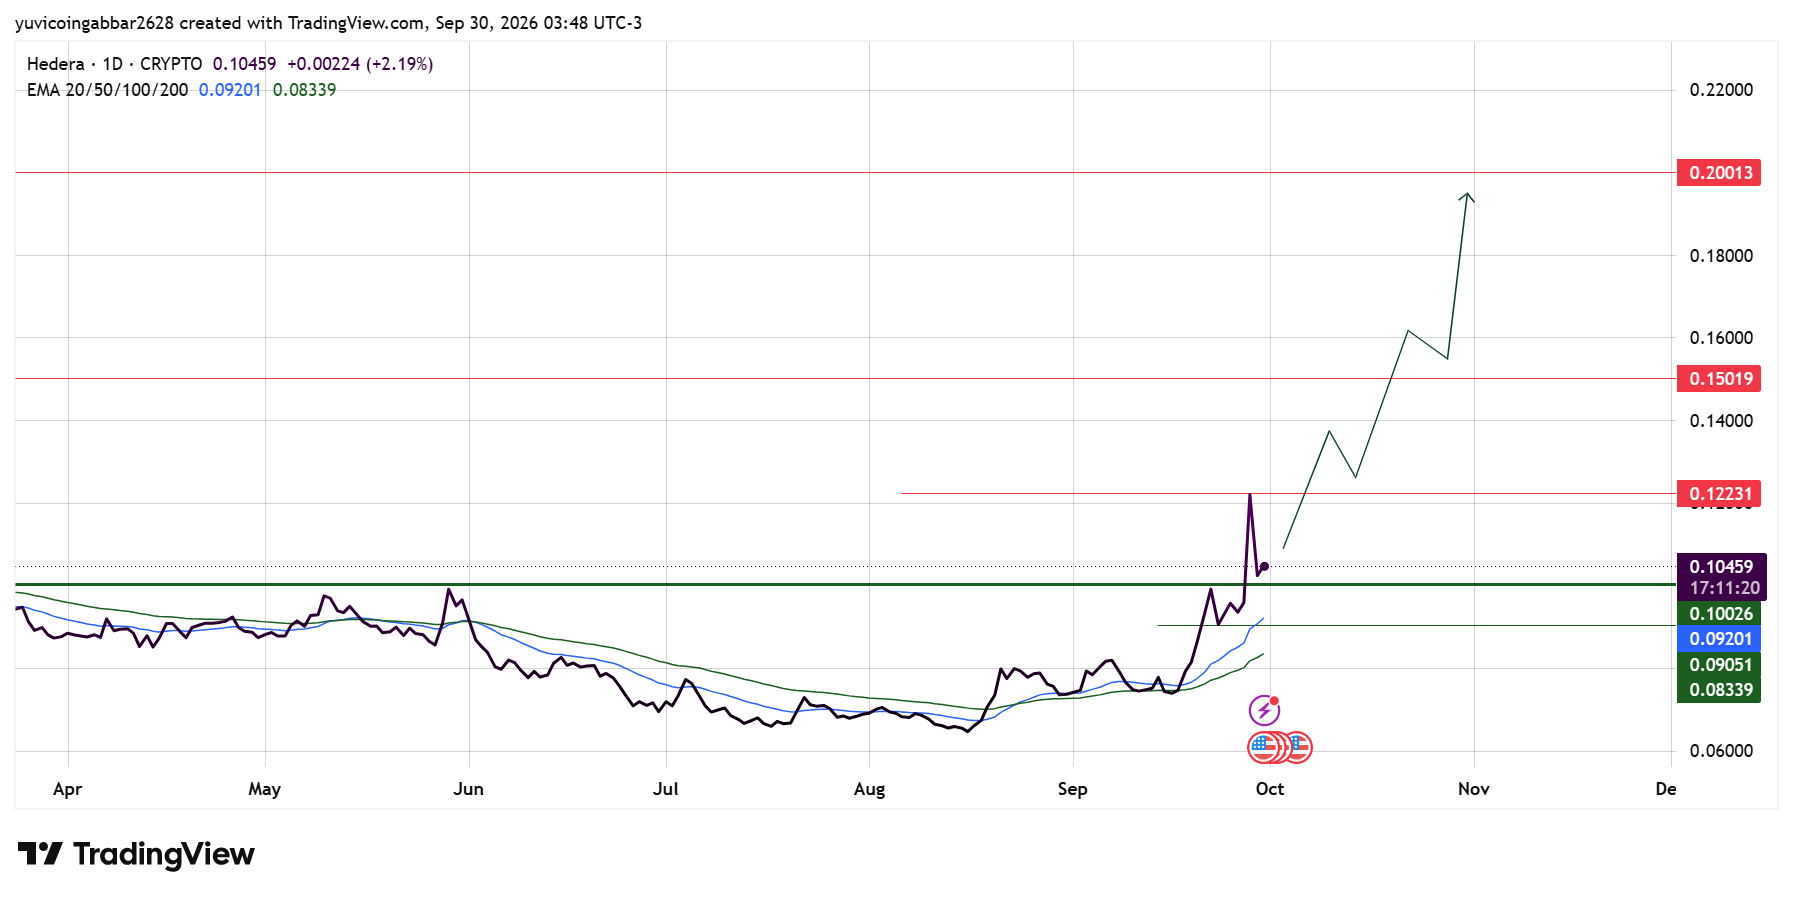
Since then, the price has climbed back, with a sharp spike in the past few days. Hedera Price Today is trading at $0.10459, down 10% on the day.
Both EMAs now sit below price and have turned upward, with the 20 EMA at $0.09201 and the 50 EMA at $0.08339, confirming the recent move has shifted the short-term trend higher.
The $0.10026 level, close to where price is trading now, is the nearest support if this recovery pulls back.
Hedera Outlook: Key Levels
Level Type | Price |
Resistance 3 | $0.20013 |
Resistance 2 | $0.15019 |
Resistance 1 (nearest) | $0.12231 |
Immediate Price Reference | $0.10459 |
First Confirmed Support | $0.10026 |
Hedera Forecast
Bull case: If the price holds at $0.10026, the recent spike looks like the start of a genuine trend change rather than a one-off move.
A close above $0.12231 would open the way toward $0.15019, and continued momentum could eventually put $0.20013 in range.
Bear case: A close below $0.10026 would risk a slide back into the EMA zone between $0.09201 and $0.08339.
Given how sharp and fast the recent spike was, a pullback of that size wouldn't be unusual after such a quick move.
Hedera Price Prediction: Can HBAR Reach $4.11?
Nothing on this chart supports it. The highest level actually marked is $0.20013, and even the first cited target, $0.50, sits well above that.
Reaching $4.11 would mean HBAR rising roughly 39 times from its current price, far beyond anything the technical chart or the marked levels point to. Treat this figure as speculation, not a chart-based forecast.
Hedera Price Prediction 2026: Expert View
According to CoinGabbar analysts, HBAR's recent bounce off its August lows is a real, chart-visible move, and holding $0.10026 would support the case that it continues.
That's separate from claims of an "inevitable" parabolic run to $4.11 from an unnamed analyst with no data attached. The level that matters for now is $0.10026, not the headline figures circulating about it.
Disclaimer
This piece is for informational purposes only and isn't financial advice. The levels and scenarios above are based on technical chart analysis and publicly available data at the time of writing. Crypto markets can move sharply within hours, so past patterns don't guarantee future outcomes. Do your own research and consider your risk tolerance before acting on any level discussed here.










.webp)











