Pi Network Price Prediction: Will Coixa News Lift PI Above $0.09041?


Pi Network is trading near its 24-hour low, and only $8.4 million in the past day. That is thin for a coin with a market cap close to $1 billion, and it shapes this Pi Network Price Prediction.
Pi Coin comes from Pi Network, a project launched in March 2019 by Stanford PhDs Nicolas Kokkalis and Chengdiao Fan.
Users earned tokens through a mobile app before the open mainnet went live in February 2025.
The Pi Network coin has a maximum supply of 100 billion PI and ranks 78th by market cap.
Pi Network price today is $0.08719, down 4.4% over 24 hours and 1.7% against Bitcoin.
The Pi current price sits at the low end of a 24-hour range from $0.08703 to $0.09127.
Pi Coin Live Market Data
Metric | Value |
Price | $0.08719 |
24h Change | -4.4% |
24h Range | $0.08703 to $0.09127 |
Market Cap | $980.263M |
Source: market data taken from CoinGecko, as of Sep 24, 2026. Figures may vary slightly across other tracking websites.
Pi Coin News: Coixa Wallet Launch Draws Attention
The latest Pi Coin news comes from a community post about Coixa, a non-custodial financial platform built around Pi Network and Stellar.
The post says Coixa is live on Android and web. Its launch graphic, however, shows an Android launch on September 25, 2026, at 14:00 UTC, so the timing is unclear.
Source: Data Taken From @PiNetworkAlerts, X Account, as of Sep 24, 2026
The post also claims a DEX and trading terminal, a fiat on-ramp to buy PI, and a 96 out of 100 score from a 260-page audit.
These are project claims. No independent audit or user data was reviewed here, so none of them is confirmed. Anyone considering a new wallet should verify the source before connecting keys or funds.
For readers tracking Pi Network news, a wallet launch is a positive headline but not a price catalyst by itself. Our Pi Network news analysis is measured.
A working gateway could add utility over time, but it does not show in the data yet. PI is still down 4.4% with only $8.424 million in volume.
Pi Network Price Prediction: 4H Technical Analysis
This Pi Network technical analysis uses the 4-hour PI/USDT chart from OKX on TradingView, captured at 14:29 IST (UTC+5:30) on September 24, 2026.
PI is moving inside a descending channel that began on September 22. Price rallied from about $0.0803 to above $0.094, then started making lower highs and lower lows.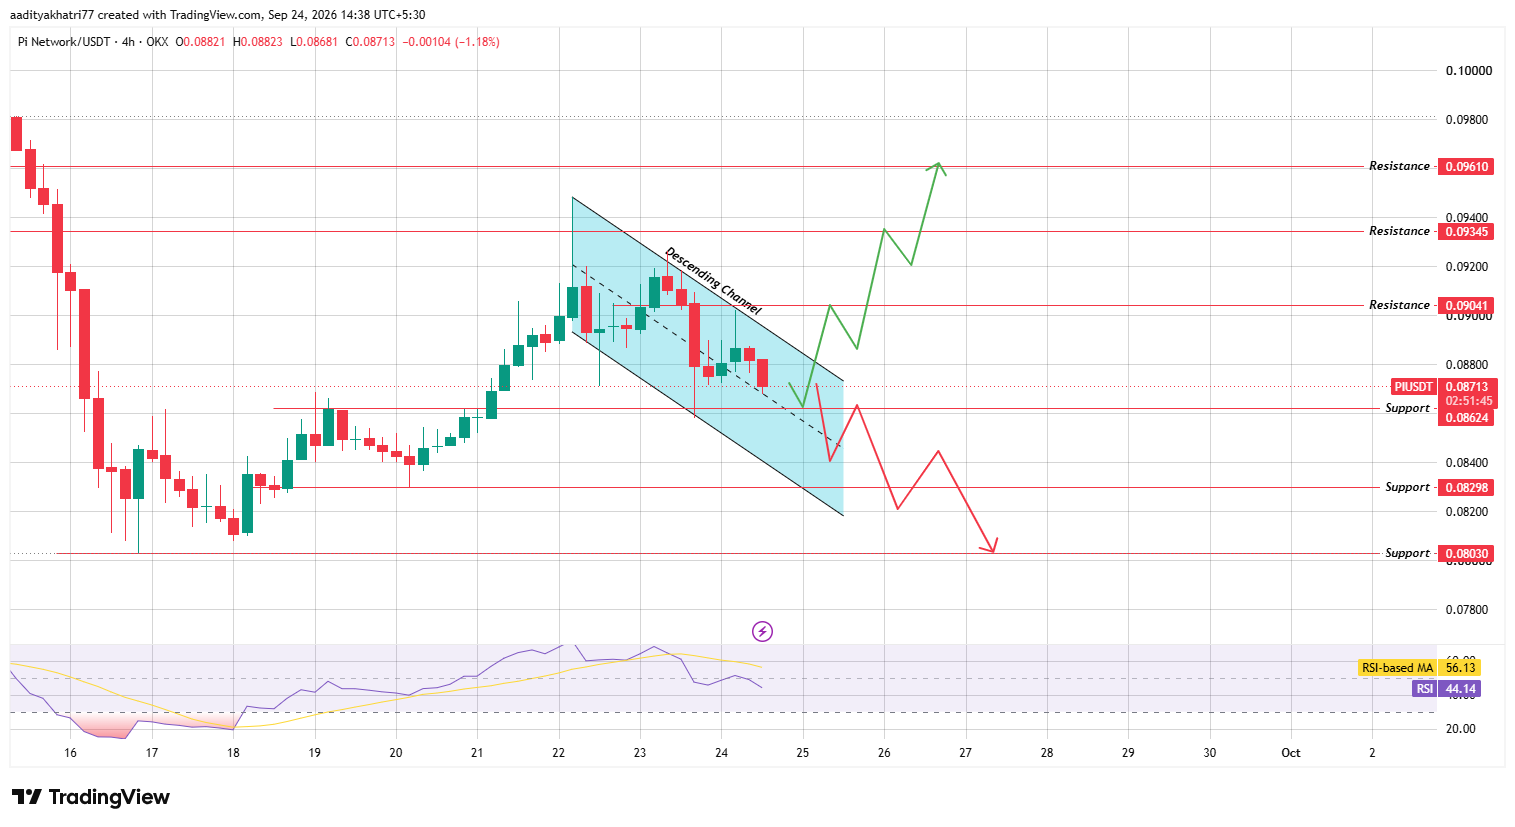 Source: Chart taken from TradingView, as of Sep 24, 2026
It now sits near the channel middle, just above $0.08624 support. That level acted as resistance during the September 19 to 21 rally, and a wick dipped below it on September 23 before the price recovered.
The RSI reads 44.39, under the 50 midline and well below its moving average of 56.15. Momentum has faded since the September 22 peak.
Can Pi Network Break the Channel and Move Higher?
The bullish case starts with a bounce from $0.08624. Price must then break the upper boundary of the channel and clear $0.09041, about 3.7% above the chart price.
A 4H body close above both would confirm the move, with volume at least 1.5 times the average of the previous 20 candles. Daily volume is thin, so a breakout without strong volume can fail fast.
If the move holds, the next levels are $0.09345, roughly 7.2% higher, and $0.09610, about 10.2% higher.
A retest of the broken boundary along the way would be normal. That path would support a constructive Pi Network forecast for early October.
What Happens If Pi Network Breaks Support?
The bearish case begins with a 4H body close below $0.08624. The next level is $0.08298, about 4.8% under the chart price.
Below it sits $0.08030, roughly 7.9% lower, which matches the September 17 low. A move there would erase the whole rally.
Pi Network Price Levels
Support | Resistance |
$0.08624 | $0.09041 |
$0.08298 | $0.09345 |
$0.08030 | $0.09610 |
Bull, Base, and Bear Scenarios
Scenario | Setup | Level |
Bull | 4H body close above the upper channel boundary and $0.09041 with strong volume | $0.09345, then $0.09610 |
Base | Price stays inside the channel above $0.08624. | $0.08624 to $0.09041 |
Bear | 4H body close below $0.08624 | $0.08298, then $0.08030 |
Pi Coin Market Analysis: Liquidity and Supply
This Pi Coin market analysis rests on three points. First, PI fell 4.4% in dollars and 1.7% against Bitcoin, which implies Bitcoin lost roughly 3%. Most of the decline follows the wider market.
Second, daily volume of $8.424 million equals about 0.86% of market cap. In a market this thin, single orders can move prices easily.
Third, about 6.05 billion PI sit outside circulation. The data does not say when they may enter the market. Anyone building a Pi Network Outlook should keep that gap in view.
Expert Opinion
General market commentary on PI focuses on liquidity and supply as much as on the chart.
Analysts usually treat a descending channel as bearish until the price closes above its upper boundary. Thin volume adds risk in both directions.
Any Pi Network price prediction should sit beside a fixed exit plan. PI fell 4.4% in a day, and gaps between levels can be wide.
Disclaimer: This article is for information only and is not financial advice. PI is highly volatile, trades on thin volume, and fell 4.4% in 24 hours. Technical levels can fail, and price can move against every scenario above, including a total loss of invested capital. The scenarios carry no stated probability. Do your own research and never risk money you cannot afford to lose.

















