Electroneum Price Prediction 2026-2030: ETN Can Recover?


Any Electroneum price prediction starts with today's numbers, like other crypto price prediction guides do.
Electroneum price today sits near $0.003486, up 89.84% in 24 hours.
The trend is bullish but stretched. Immediate support sits at $0.002701-$0.003041, with resistance at $0.004988.
RSI reads 91.38. The next key target is $0.004988, then $0.005913.
A daily trade below $0.002701 breaks the setup. A cooldown is likelier than a straight run higher.
ETN Quick Prediction Box
Metric | Reading |
ETN Price | $0.003486 (CoinMarketCap) |
24H Change | +89.84% |
Trend | Bullish, overextended |
RSI | 91.38 |
Support | $0.002701-$0.003041 |
Resistance | $0.004988 |
Near-Term Target | $0.004988 |
Bull Case | $0.0050-$0.0077 |
Base Case | $0.0027-$0.0050 |
Bear Case | $0.0018-$0.0027 |
Invalidation | Daily trade below $0.002701 |
Analysis Time | September 24, 2026, 06:00 UTC |
Electroneum Price Today and Market Snapshot
ETN Price, Market Cap, and 24H Volume
ETN is moving. Fast. CoinMarketCap listing data shows $0.003486 at rank #348 (September 24, 2026, about 06:00 UTC).
Market cap is $62.67M. And 24H volume is $404.71K.
Circulating supply is 17.97B ETN, against a 21B cap.
Turns out, venues disagree. When we checked the exchange table, HTX showed $0.002703, while Biconomy showed $0.003965.
Electroneum Technical Analysis and Current Trend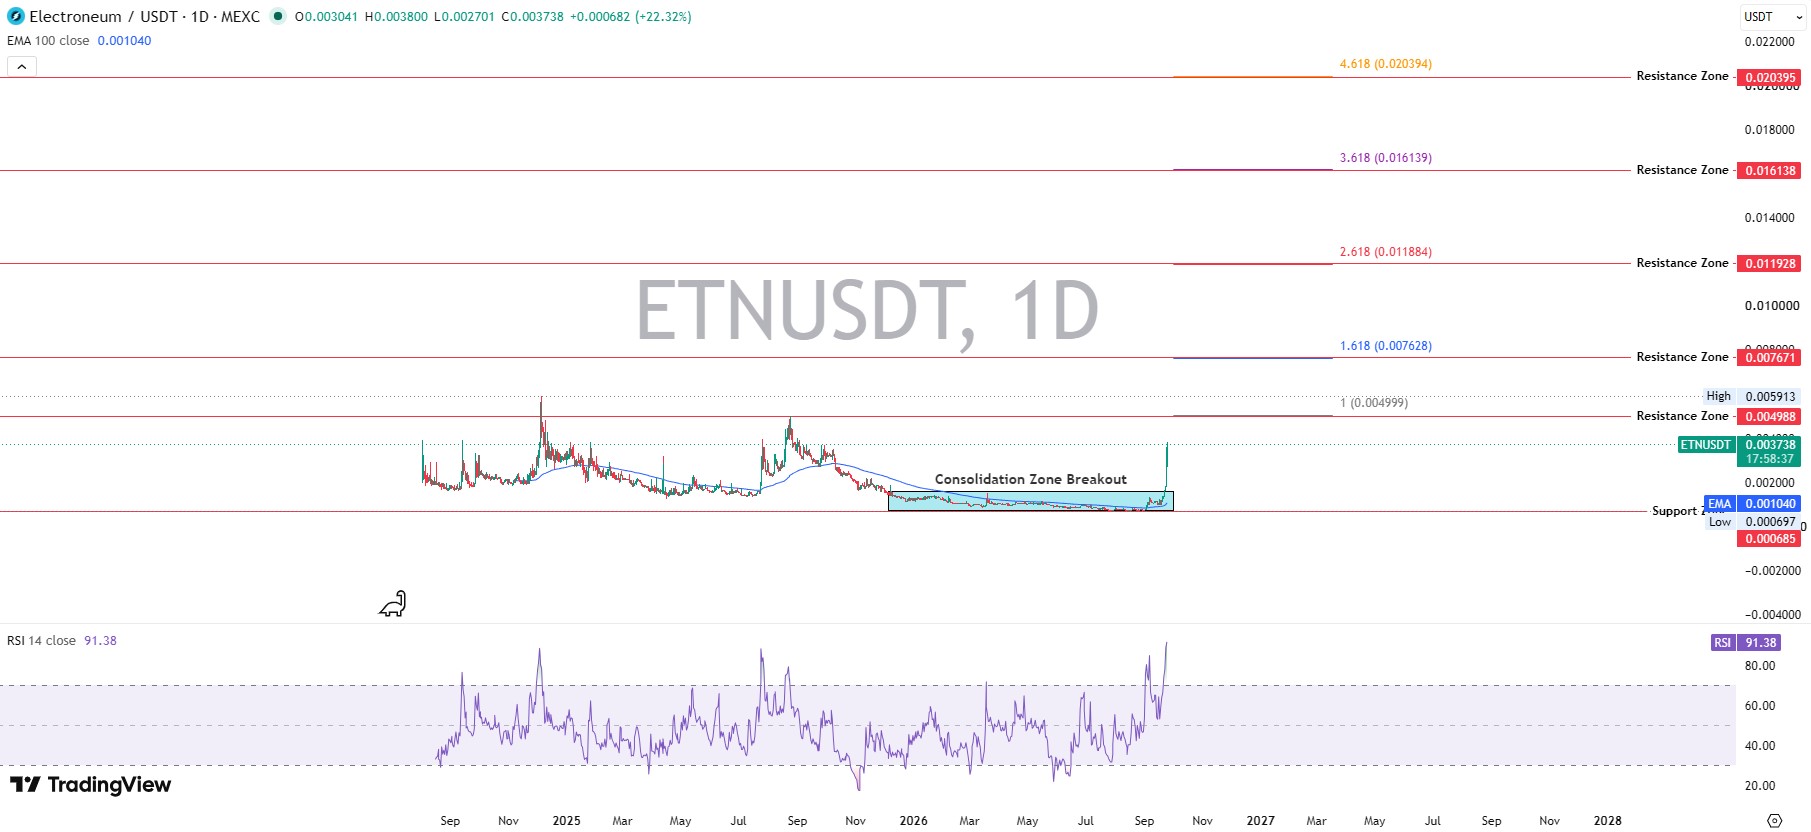
ETN RSI and Momentum
ETN RSI (relative strength index, a 0-100 gauge of buying heat) reads 91.38. Above 70 counts as overbought.
When we pulled up the RSI on TradingView charts, the near-vertical line stood out.
MACD (a trend gauge from two moving averages) reads 0.000448 against a 0.000206 signal line. Momentum is strong, yet...
Strong isn't safe.
Turns out, the last two RSI peaks near 90 both preceded long pullbacks.
$ETN Support and Resistance Levels
$ETN support and resistance start at $0.003041 (primary) and $0.002701 (secondary, today's low).
Primary resistance: $0.004988, near the 1.0 Fibonacci extension (a ratio-based projection tool). Secondary: $0.005913, the prior peak.
What $ETN Needs for a Breakout
Three boxes must tick: a daily trade above $0.004988, a solid daily candle (one day's price bar) holding there, and rising volume.
But 24-hour turnover of $404.71K is thin. Fresh exchange listing updates would deepen liquidity.
Buyers hold control, at least until basically, no volume, no breakout.
Breakdown Risk Below Support
First downside trigger: a daily trade below $0.002701. Next support: $0.001805, then the 100-day EMA (a smoothed price trail) at $0.001040.
The setup is bullish. Well, early is the better word, since RSI at 91.38 rarely holds.
Giving back a large slice after an 89.84% day is normal. But a full round trip into the old consolidation zone would invalidate the breakout.
Electroneum Price Prediction for 2026
These ETN price prediction ranges are conditional.
Scenario | Price Range | Condition |
Bear | $0.0018-$0.0027 | Breakdown or weak market |
Base | $0.0027-$0.0050 | Range continuation |
Bull | $0.0050-$0.0077 | Breakout plus volume |
Catalysts appear on a coin events calendar first.
Can a token that just jumped 89.84% in a day keep that pace?
Electroneum Price Prediction for 2027
ETN price prediction 2027 rests on market cycle, adoption, supply, and liquidity.
A healthy crypto market lifts small caps first. And a weak one hits them hardest.
Wallet growth from crypto airdrop campaigns would count more than headlines. Supply is manageable, with 17.97B of 21B ETN circulating.
Liquidity is the constraint, because thin volume caps any rally. Base range: $0.003-$0.008, or $54M-$144M market cap.
Electroneum Price Prediction for 2028-2030
$ETN Forecast for 2028
ETN forecast 2028 targets $0.004-$0.012, a $72M-$216M market cap. AI-linked EVM apps, covered in AI crypto news, could attract developers.
$ETN Forecast for 2029
ETN forecast 2029 sits at $0.005-$0.016, or $90M-$288M. New launches on crypto presale listings compete for liquidity.
$ETN Forecast for 2030
$ETN forecast for 2030 spans $0.006-$0.020, or $108M-$359M. Even that sits far below the $0.2362 peak of 2017.
What Could Drive $ETN Higher?
Bullish Catalysts
SonarX, a blockchain data provider, now indexes Electroneum Smart Chain (ETN-SC) alongside 130+ networks, per a September 21 post. And Bitcoin's strength would add fuel.
Tangem Wallet Support
Tangem, a hardware wallet maker, announced ETN support on September 22, 2026. Easier access can widen the buyer base.
Official Network Messaging
An official Electroneum post calls $ETN an EVM-compatible Layer-1 (a base blockchain) with ultra-low fees since 2024. EVM means Ethereum Virtual Machine.
A September 6 teaser hints at major news. Unconfirmed.
What Could Push $ETN Lower?
Market-wide risk-off conditions hit small caps first. Declining liquidity widens spreads.
Loss of support at $0.002701 would trigger stop orders. But weak volume on bounces would expose fading demand.
Capital chasing meme coin news can drain utility tokens. Project setbacks or regulatory risks would add pressure.
$ETN Bull, Base, and Bear Case
Bull Case: A daily trade above $0.004988 with rising volume targets $0.005913, then $0.007671, in Q4 2026-Q1 2027.
Base Case: Price ranges $0.0027-$0.0050 while RSI cools through Q4 2026.
Bear Case: A breakdown below $0.002701 targets $0.0018-$0.0027. Invalidation: a trade back above $0.003800 with volume.
Key Levels Traders Should Watch
Level | Why It Matters | Confirmation |
Support 1: $0.002701-$0.003041 | Short-term defense | Hold or reclaim |
Support 2: $0.001805 | Major downside zone | Breakdown below |
Resistance 1: $0.004988 | Immediate ceiling | Daily trade above |
Resistance 2: $0.007671 | Bullish expansion | Volume confirmation |
Disclaimer: This article is for information only and isn't financial advice. Crypto prices are volatile, and forecasts can fail.

















