Polkadot Price Prediction: Can This Breakout Send DOT to New High?


Polkadot is building a way to prove someone is a real human without collecting their identity, right as DOT claws its way back from a long slide.
This Polkadot price prediction looks at whether DOT can hold its recovery and clear $1.2751.
Polkadot Price Prediction Technical Analysis
This chart tells a longer story than the usual short-term view. DOT has been in a steady downtrend since last October, falling from around $4.50 to a low near $1.00 by June through August 2026, a drop of more than 75% over roughly ten months.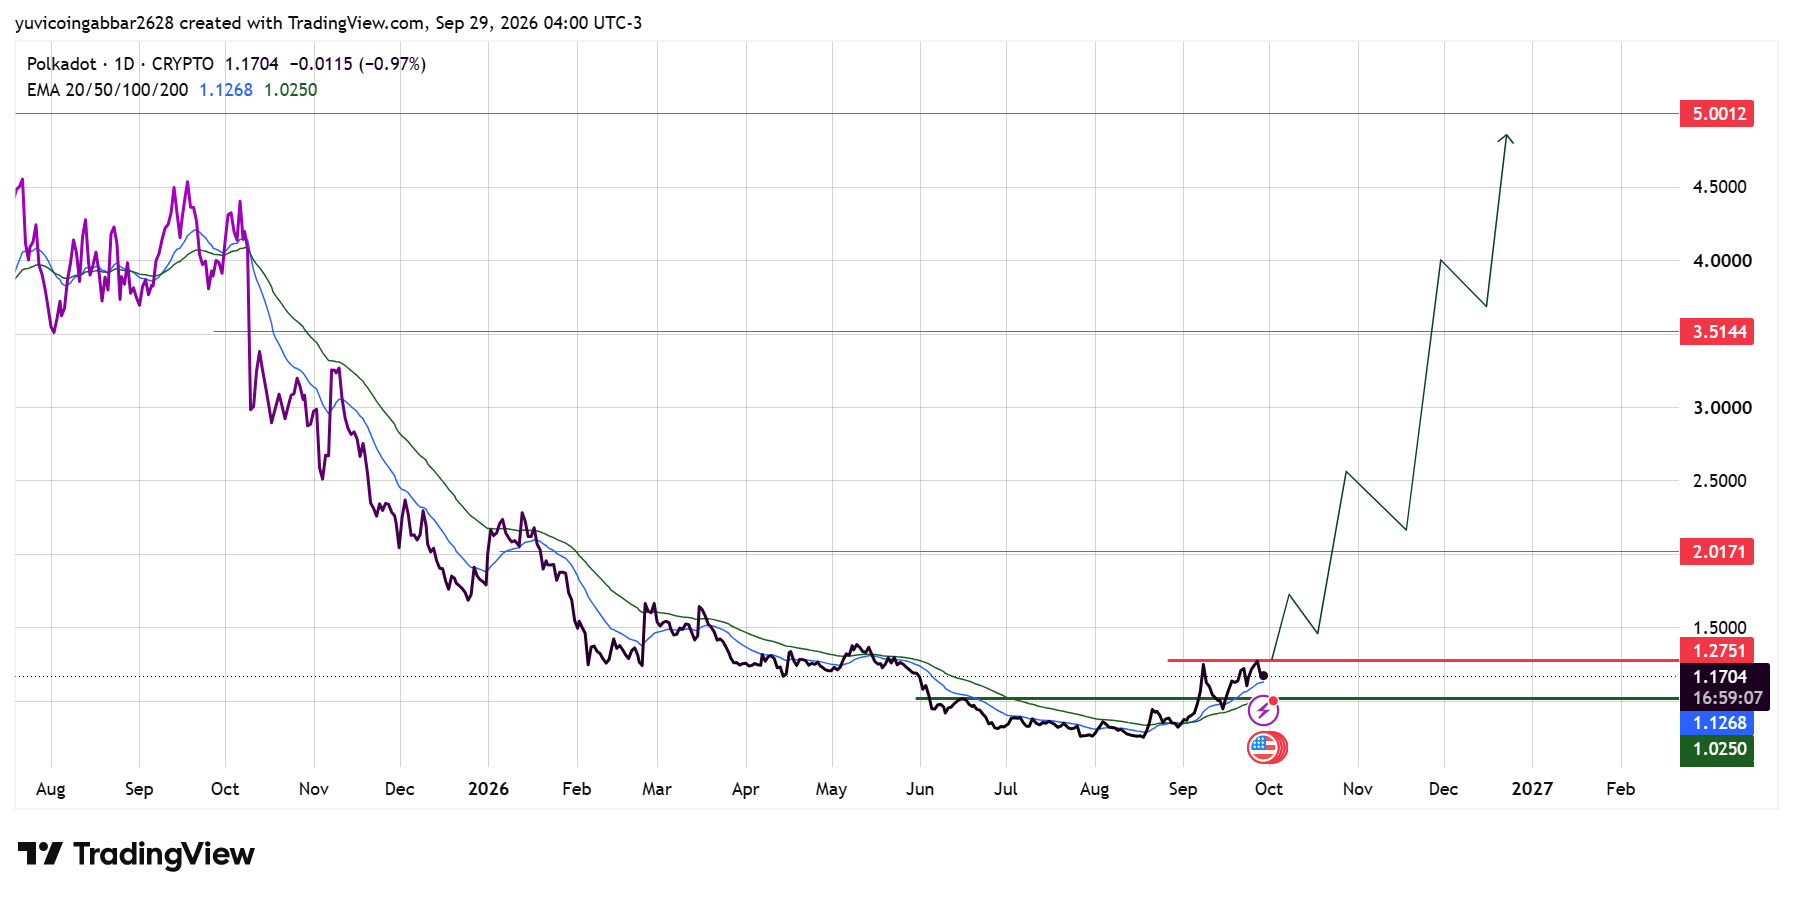
Since late August, that slide has turned into a recovery, with the price climbing back to $1.1704.
Along the way, DOT has now reached $1.2751, a level marked in red that goes back to price action from earlier in the downtrend.
The Polkadot price today is down 0.97%, with the price sitting just below that level rather than through it.
Both EMAs sit close to the current price, unlike most charts where they trail further behind.
The 20 EMA is at $1.1268 and the 50 EMA at $1.0250, so this EMA zone is the support to watch if the pullback continues.
Support and Resistance Levels
Level Type | Price |
Resistance 3 | $5.0012 |
Resistance 2 | $3.5144 |
Resistance 1 | $2.0171 |
Key Resistance (nearest) | $1.2751 |
$1.1704 | |
EMA Support Zone | $1.1268 to $1.0250 |
Polkadot Forecast
Bull case: If the price holds the EMA zone and turns back up, DOT can make another run at $1.2751. A confirmed close above that level would be the first real sign the year-long downtrend has ended, opening the way toward $2.0171.
Bear case: A close below the 50 EMA at $1.0250 would put this early recovery in doubt and risk a return toward the 2026 lows near $1.00.
Given how far DOT fell before this bounce, a failed recovery attempt is a real possibility, not just a routine pullback.
Polkadot Price Prediction: Can Polkadot Reach $5?
$5.0012 is the highest level marked on the chart and sits well above DOT's price even before this year's downtrend began.
Getting there would require clearing $1.2751, then $2.0171 and $3.5144, each a major hurdle on its own. That's a long path from a token that only recently stopped falling.
Polkadot Price Prediction 2026: Expert View
According to CoinGabbar analysts, a drop of more than 75% followed by a recovery attempt is a very different setup from a token making fresh highs, so this chart deserves more caution than a typical breakout story.
The proof of personhood plan is a genuine fundamental development, but it's a long-term product story, not something likely to move price today.
The level that actually matters here is $1.2751, since clearing it would be the first real technical evidence that the downtrend is over.
Disclaimer
This piece is for informational purposes only and isn't financial advice. The levels and scenarios above are based on technical chart analysis and publicly available data at the time of writing. Crypto markets can move sharply within hours, so past patterns don't guarantee future outcomes. Do your own research and consider your risk tolerance before acting on any level discussed here.







.webp)













