Pump.fun Price Prediction October 2026: Can PUMP Break $0.0055 Soon?


Pump.fun price prediction October 2026 searches are rising as traders watch $PUMP recover after a recent pullback.
$PUMP is trading near $0.005017, up 2.9% in the last 24 hours, with a market cap of around $2.336 billion, which ranks it #48 among all cryptocurrencies.
The PUMP price today is $0.005017. This Pump.fun price prediction looks at its history, market data, and the latest burn numbers.
Live $PUMP Market Data
Metric | Value |
Price | $0.005017 |
24H Change | +2.9% |
24H Range | $0.004682 - $0.005534 |
Market Cap | $2.336B |
Source: market data taken from CoinGecko, as of Sep 29, 2026. Figures may vary slightly across other tracking websites.
The gap between the market cap (2.336B) and the Fully Diluted Valuation(4.17B) shows that a large part of the supply is not yet in circulation.
Traders often watch this closely, because future token unlocks can add selling pressure.
Pump.fun News Today: $6.85M Buyback and Burn
The latest Pump.fun news today comes from the project's ecosystem account on X. It said that over the past 7 days, Pump.fun bought back and burned $6,854,900 worth of $PUMP.
According to the post, total buybacks and burns now stand at $466,500,000, which removes 29.673% of the circulating supply.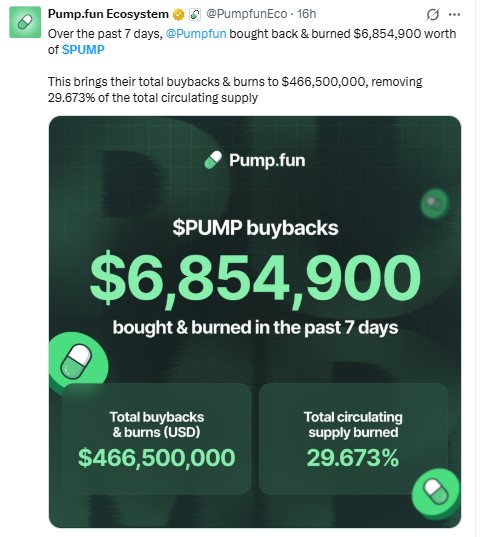
Source: Data taken from @PumpfunEco, X Account, as of Sep 29, 2026
Buybacks reduce the number of tokens available on the market, which can support the price over time.
Still, $6.85 million in a week is small compared to a market cap of over $2 billion, so it works as a support for sentiment and not as a guaranteed price driver on its own.
Pump.fun Technical Analysis
This Pump.fun technical analysis starts with the pattern that has formed on the hourly chart.
On the 1-hour chart, $PUMP has formed an inverse head and shoulders, a bullish reversal pattern made of three lows, with the middle low (the head) being the deepest.
Price made the left shoulder near $0.00476, dropped to the head near $0.00467, and then formed the right shoulder before pushing higher.
It has now broken above the neckline and is trading around $0.005047 on the Binance PUMPUSDT chart.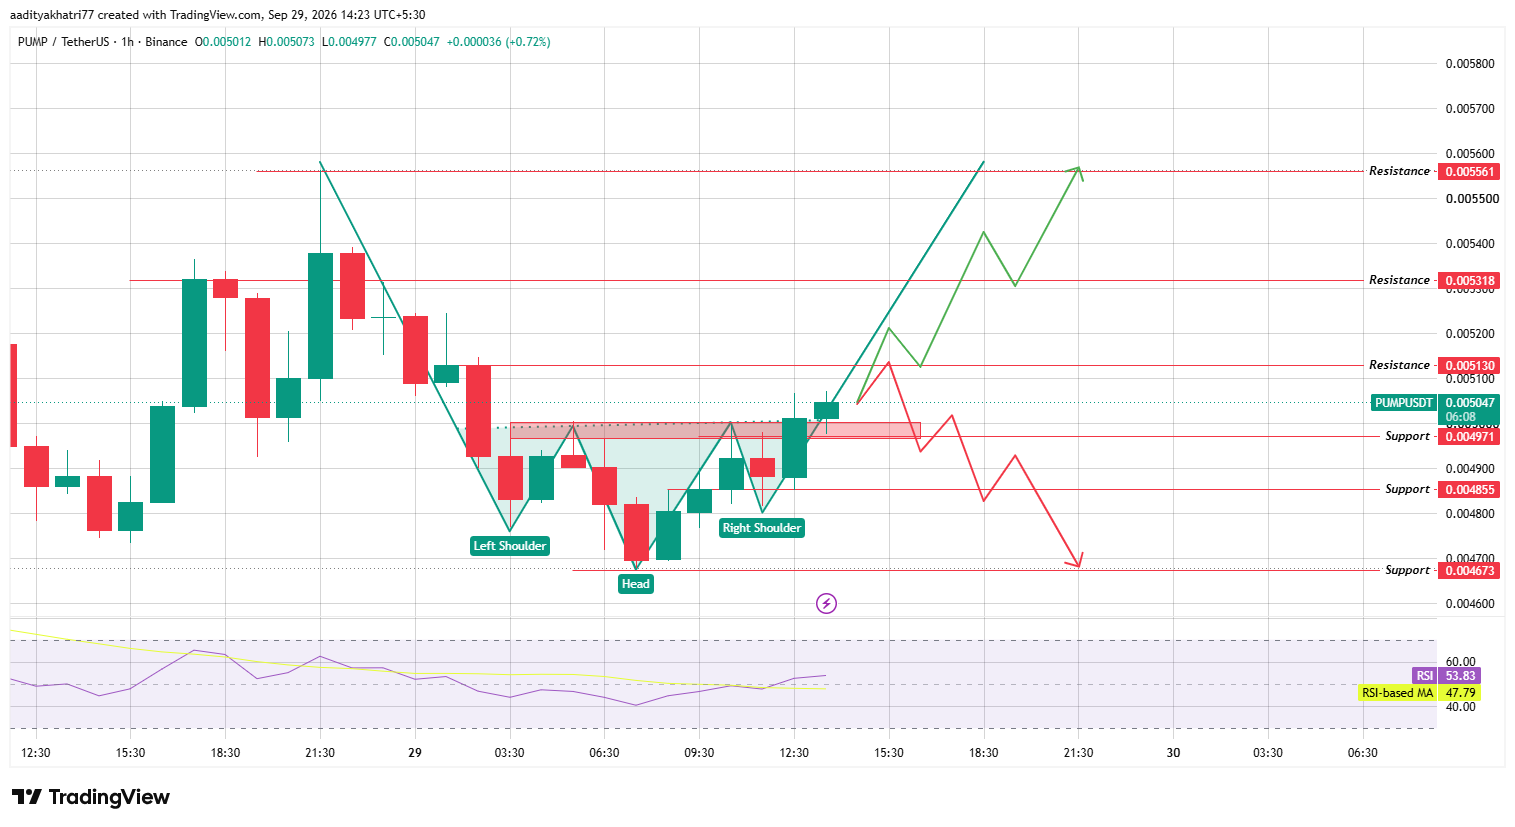
Source: Chart taken from TradingView, as of Sep 29, 2026
RSI reads 53.83, above its moving average of 47.79. This shows that momentum has turned in favor of buyers, and the RSI has moved above the 50 midline.
The neckline zone near $0.004971 now acts as the first support, and a retest of this level is common after a neckline break.
Can $PUMP Push Toward Higher Resistance?
The bullish setup depends on how price behaves above the neckline. If $PUMP holds above the $0.004971 support and keeps its momentum, the first hurdle is the $0.005130 resistance.
A clean break above $0.005130 opens the path toward $0.005318. If buyers stay in control and volume supports the move, the next target is $0.005561, which is close to the recent swing high.
The pattern is more reliable when the breakout comes with rising volume. A move without volume can turn into a false breakout and fall back below the neckline.
What Happens If $PUMP Faces Rejection?
The bearish setup starts with rejection at resistance. If $PUMP fails to break $0.005130 and gets pushed back, price can fall toward the neckline zone again.
A loss of the $0.004971 support would mean the breakout has failed. In that case, the next downside target is $0.004855.
If sellers stay in control, $0.004673 becomes the next major support, which is also near the low of the head.
A failed breakout can move fast, because traders who bought the neckline break may exit together. That is the risk on the other side of this trade.
Pump.fun Price Levels to Watch
Support | Resistance |
$0.004971 | $0.005130 |
$0.004855 | $0.005318 |
$0.004673 | $0.005561 |
Bull, Base, and Bear Scenarios
Scenario | Setup | Level |
Bull | Neckline holds, resistance breaks with volume | $0.005130 to $0.005561 |
Base | Retest of neckline, range trade | $0.004971 to $0.005130 |
Bear | Resistance rejection and support break | $0.004855 to $0.004673 |
Pump.fun vs Bitcoin
Bitcoin's direction usually sets the tone for altcoins like $PUMP. A risk-on market helps breakouts hold above resistance, while a risk-off move can pull PUMP's support levels lower no matter what the chart says.
Against Bitcoin, PUMP is up 1.6%, which shows it is currently outperforming the market leader.
Methodology
This Pump.fun price prediction was built from a 1-hour PUMPUSDT chart sourced through Binance via TradingView.
The inverse head and shoulders structure, the neckline, the RSI, and the RSI-based moving average were checked candle by candle.
Support and resistance levels came directly from the marked price zones on that chart.
Live price, market cap, volume, and supply figures came from a CoinGecko snapshot, and the buyback data came from a post on X, both taken the same day.
Nothing here substitutes for independent research. A chart pattern only describes probability, not certainty, and a pattern on the hourly chart can change quickly.
Expert Opinion
Based on the chart and the burn data, the setup for October leans cautiously constructive while $PUMP stays above the neckline.
RSI is above its average, and the buyback program gives the token a steady supply-side story.
At the same time, this is a short-term hourly pattern, and the large gap between market cap and fully diluted valuation is a risk to keep in mind.
A breakout means little if PUMP cannot clear $0.005130 with volume behind it.
Disclaimer: This article is for informational purposes only and does not constitute financial advice. Cryptocurrency markets, including Pump.fun, carry high volatility and downside risk; prices can move sharply against any projected level, and past performance offers no guarantee of future results. Readers should conduct independent research before making any investment decision.








.webp)













