Arbitrum Price Prediction July 2026: Can $ARB Reclaim $0.15?


Arbitrum's native token, ARB, has spent the last several weeks grinding through a tight, narrowing range, and traders watching the order books are split on what comes next.
Volume is still flowing in from the biggest venues, liquidation data shows one side of the market getting squeezed harder than the other, and the chart itself sits right at a decision point.
Put those threads together, and this Arbitrum price prediction July 2026 outlook leans toward a market that is coiled rather than collapsing, though a move higher still needs confirmation before it becomes the base case.
What Is Driving Arbitrum Price Prediction Right Now?
ARB is trading near $0.0874 this week, up modestly on the four-hour chart after weeks of lower highs inside a descending channel.
The near-term case for this Arbitrum price prediction outlook rests on three inputs: exchange volume concentration, a liquidation profile that recently hit long-side traders are the hardest, and a daily chart that has already reclaimed part of its June losses.
None of these alone confirms a breakout, but together they describe a market testing resistance rather than breaking down further.
What Are Analysts Saying?
Part of this Arbitrum price prediction picture comes from trader Michaël van de Poppe, who posts on X under the handle CryptoMichNL. 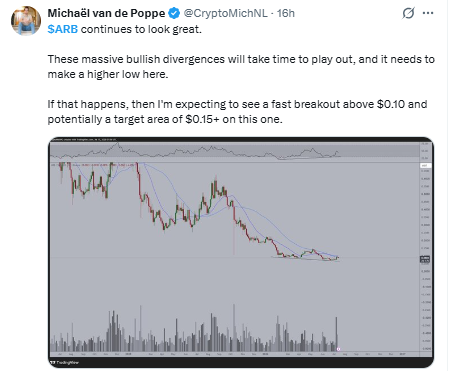
He pointed to bullish divergence on the chart and said a higher low needs to form before any move higher plays out, framing a close above $0.10 as the trigger for a faster push toward $0.15.
What Do Liquidation Trends Reveal About Traders?
As per Coinglass Liquidation data, it tells a more interesting story than volume alone.
Over the trailing 24 hours, long positions accounted for $516.32K of the $554.67K wiped out, versus just $38.35K on the short side. 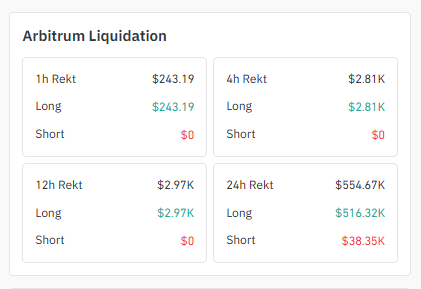
That imbalance suggests leveraged longs got caught leaning into the pullback from the recent local high, a normal feature of a descending channel rather than a bearish signal on its own.
The shorter 1h and 4h windows showed much smaller totals, meaning the immediate pressure had already eased even as the 24h picture still shows long-observing most of the pain.
How Is Exchange Volume Shaping the Outlook?
Futures volume data aggregated via CoinGlass shows Binance carrying the largest share of activity at $34.63M, with Bybit next at $18.53M and BingX behind at $16.45M. 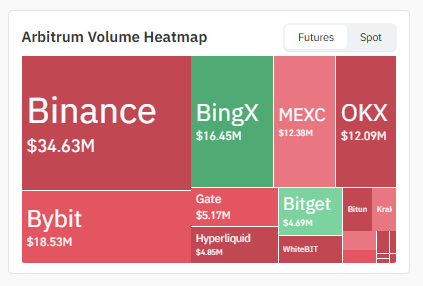
MEXC and OKX each cleared roughly $12M, while Gate, Bitget, Hyperliquid, and WhiteBIT rounded out the mid-tier.
That concentration on two or three top venues means a coordinated move on Binance or Bybit tends to ripple across the market within minutes.
Four-Hour Chart Analysis: Descending Channel
The shorter-term picture is less settled. Price has been sliding inside a descending channel on the 4-hour chart since mid-month, with resistance stacked at $0.0933 and $0.0998 and support at $0.0860 and $0.0806. 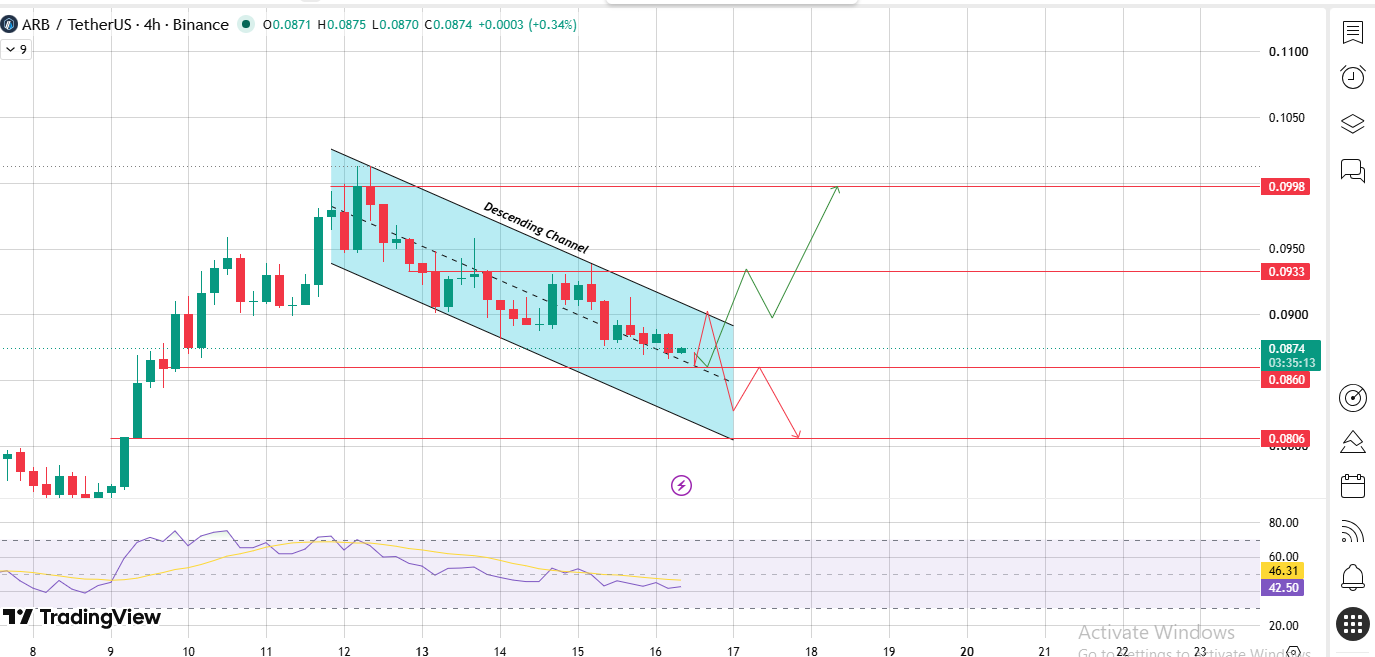
Source: Chart Taken From TradingView
A close above the channel's upper boundary would open the door toward those resistance levels, while losing $0.0860 could send the price back toward $0.0806.
The 4-hour RSI near 42.5 and a moving average near 46.31 both point to a market still deciding direction.
What Does the Daily Chart Say for Arbitrum Price Prediction?
On the daily timeframe, the price fell from roughly $0.12 in April to a low near $0.0734 in June before recovering back above $0.0875. 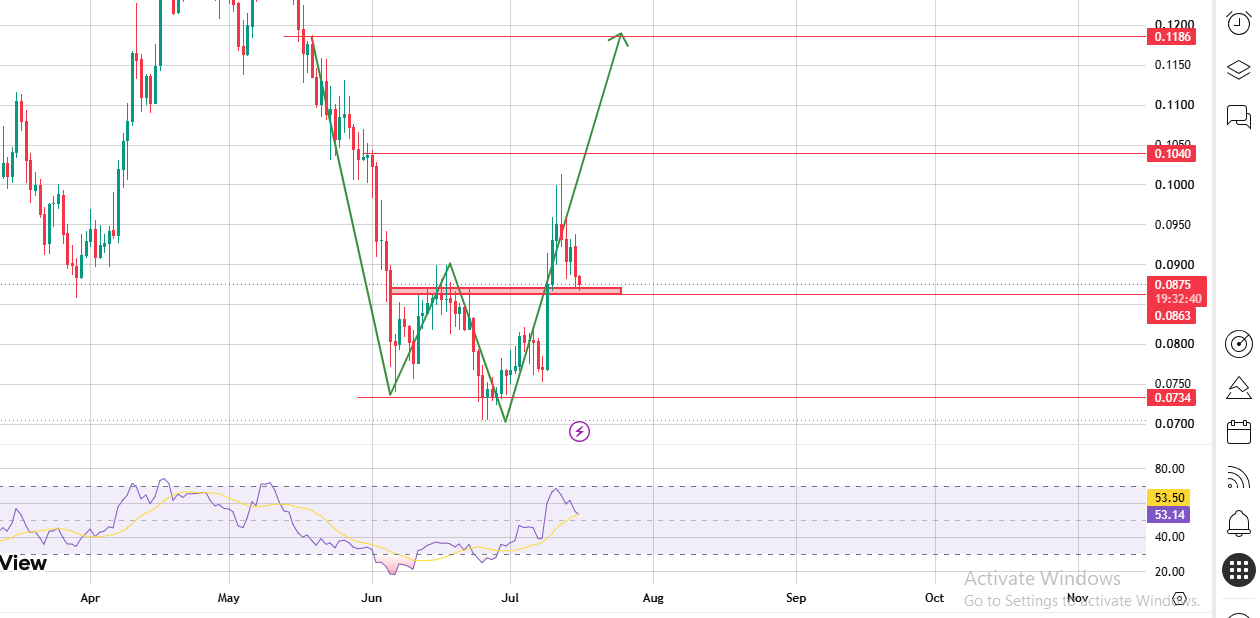
Source: Chart Taken From TradingView
That level now acts as short-term support, with $0.1040 as the next hurdle and $0.1186 marked as a longer-range target if momentum extends.
The daily RSI sits around 53.14, a neutral to mildly constructive reading that neither confirms exhaustion nor an overbought condition.
Quick Answer for Traders
Arbitrum is consolidating between roughly $0.0806 and $0.0998 on the 4h chart, with the daily structure pointing toward $0.1040 and $0.1186 if support at $0.0875 holds.
This Arbitrum price prediction view stays neutral until momentum readings shift and the price closes decisively outside the current channel.
Bull Case vs. Bear Case
Bull Case
If support in the $0.0860 to $0.0875 band holds and the higher low van de Poppe flagged forms, a break of the channel toward $0.0933 and then $0.0998 becomes plausible, with $0.1040 and $0.1186 as extended daily targets.
Bear Case
A failure to hold $0.0860 risks a retest of $0.0806. Longs already absorbed most of the last 24 hours in liquidations, so another leg down could trigger a fresh flush before any recovery attempt.
Expert Opinion
Analysts covering this setup generally describe it as balanced rather than decisively bullish or bearish.
The daily recovery off the June low is constructive, but the 4h descending channel and neutral momentum readings suggest confirmation is still needed before treating any single target as likely.
The $0.0860 support and $0.0933 resistance levels look most likely to decide the near-term direction.
Disclaimer: This article is for informational purposes only and does not constitute financial, investment, or trading advice. Cryptocurrency markets, including Arbitrum, are highly volatile, and price levels discussed here may not materialize. Readers should conduct their own research and consult a licensed financial advisor before making investment decisions.
Also read:
















