Bitcoin Price Prediction: BTC Stalls Near $65K, What Comes Next?


Bitcoin price today: BTC struggles to hold $65,000
Bitcoin price is trading around $64,822 at the time of writing, down slightly over the past 24 hours.
The coin tried to push above $65,000, but sellers stepped in fast.
This is not the first time $BTC has failed at this level. Traders are watching closely to see if buyers can try again.
Why does the $65,000 level matter for BTC price?
The $65,000 zone has turned into a wall for bulls over the past few sessions.
A daily close above this level could open the door to $67,500. Some traders even see a path to $68,000 if momentum builds.
But until that close happens, this remains a resistance zone, not a breakout.
What do the futures and options data show?
Market data paints a mixed picture right now.
Metric | Value | Change |
Futures Volume (24h) | $46.89B | -25.29% |
Spot Volume (24h) | $3.81B | - |
Open Interest | $48.87B | +0.52% |
Options Volume | $4.36B | +1.06% |
Options Open Interest | $31.02B | +3.78% |
Long/Short Ratio (24h) | 1.0521 | - |
Open interest is rising even as spot volume looks thin. This usually means traders are placing more bets through derivatives rather than buying $BTC outright.
Liquidation data also tells a story. Over the past 24 hours, short positions lost $42.51M, much more than the $15.81M lost by longs. That suggests bears got caught off guard during recent price swings.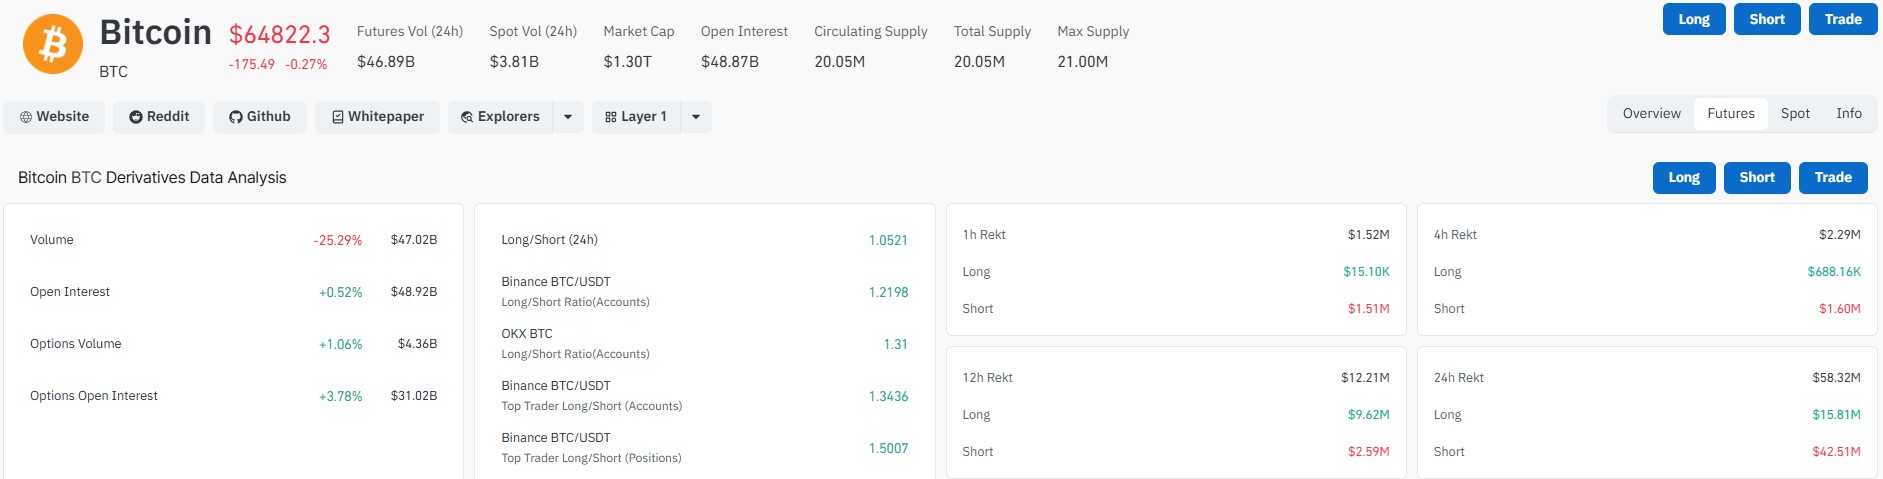
Is the weekly RSI divergence still in play for BTC price?
Chart watchers have flagged something interesting on the weekly RSI.
The last time this pattern showed up, BTC price rallied more than 700% from its low. That move took BTC from around $16,000 up toward the $120,000 area over a multi-year stretch.
Now price has slipped back down near a similar RSI zone. Whether history repeats is anyone's guess, and no one can promise the same result twice.
What does the long-term BTC chart tell us?
Zooming out on the weekly chart, Bitcoin has moved through several major growth phases against its 200-week moving average.
Past rallies from the 200 SMA have produced gains ranging from around 270% to over 8,000% in earlier cycles, though each cycle has cooled off differently.
The current phase shows $BTC consolidating between the $36,000 support zone from the last cycle and highs near $130,000 touched more recently.
What are BTC ETF inflows signaling right now?
Spot Bitcoin ETFs recorded a net inflow of $107.80 million in the latest session.
This shows that institutional demand has not dried up, even while price struggles near resistance.
Steady ETF inflows during a sideways price stretch are often seen as a sign that larger players are accumulating rather than exiting.
Bitcoin price prediction: what could happen next?
According to the Bitcoin price forecast, if Bitcoin price manages a daily close above $65,000, the next stop could be the $67,500 to $68,000 range.
Failure to hold this level, though, could send BTC back toward the $60,000 to $62,000 zone to retest support.
Traders following the Ali Charts split strategy of keeping long-term holdings separate from short-term trades may see this as a normal cooldown phase rather than a trend reversal.
Nothing here is guaranteed. Bitcoin price can move fast in either direction, and traders should watch volume and the daily close closely over the coming sessions.
Disclaimer
This article is for informational purposes only and should not be considered financial or investment advice. Cryptocurrency markets are highly volatile and carry significant risk. Always do your own research and consult a licensed financial advisor before making any investment decisions.
















