Audiera Price Prediction: Can BEAT Hold Its Bullish Momentum?


Something shifted for Audiera in the last few days, and the chart is not hiding it anymore. Traders who had written this coin off for dead are suddenly checking their screens twice.
Why Is Everyone Suddenly Talking About Audiera Again
Audiera price prediction chatter picked up fast this week, and it did not come out of nowhere. The coin had spent weeks grinding lower, quietly, the kind of move nobody notices until it is over.
Then buyers showed up. Not with a bang, but with steady pressure that echoed the whale buying rally we flagged just days earlier, pushing price out of a pattern it had been stuck in for almost two weeks.
Turns out, a lot of that pressure was building underneath the surface the whole time.
Basically, the sellers ran out of ammunition before the buyers did. That is usually when things get interesting.
We pulled up the chart expecting another lower high. Instead, we got a clean move through resistance, and that changes the conversation completely.
But one breakout does not confirm a trend. It just opens the door.
So where does Audiera go from here? That is the question everyone is asking right now.
What The Audiera Token Actually Is And Why It Exists
Audiera runs under the ticker BEAT on the BNB Smart Chain, built as a BEP-20 token. It positions itself inside the AI agent and onchain automation corner of crypto, an area that has pulled in a lot of speculative attention lately.
The project has built a fairly large holder base for its size, with community activity concentrated on X, where updates on usage and liquidity get posted regularly.
Audiera Coin Snapshot: The Numbers Behind Today's Move
| Metric | Data |
|---|---|
| Coin Name | Audiera |
| Ticker Symbol | BEAT |
| Blockchain | BNB Smart Chain (BEP-20) |
| Today High | $2.9066 |
| Today Low | $2.8399 |
| RSI Level | 66.48 |
| Token Type | Utility, AI Agent Ecosystem |
| Token Category | DeFi / AI Agents |
| Market Cap | $887.14M |
| 24H Trading Volume | $34M |
| 24H Volume Change | +125.38% |
| Circulating Supply | 309.26M BEAT |
| 24H Change | +31.93% |
Source: Data by CoinMarketCap
Audiera On-Chain Activity And Why The Community Keeps Growing
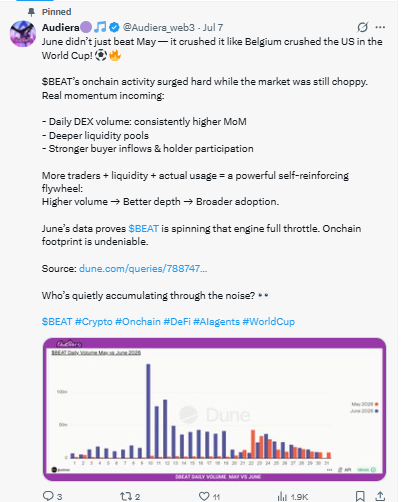
Audiera is not running on empty hype. The project posted onchain data showing daily trading volume trending higher month over month, alongside deeper liquidity pools and broader holder participation, not just louder marketing.
More usage plus more liquidity tends to feed on itself, a pattern that lined up with the 60% surge move a few weeks back. Higher volume brings better depth, better depth brings in bigger players, and that combination is what most small-cap tokens never manage to build.
Source: Posted on X Audiera
Audiera Whale Concentration Data Traders Should Not Ignore
Here's the thing: Audiera's holder base looks impressive on the surface with over 151,000 wallets, but the distribution tells a rougher story. Top 100 wallets hold 98.85% of the supply, and whale wallets alone, just 0.09% of all holders, control 99.67% of the tokens.
That is an extreme concentration level. It does not mean a crash is coming, but it does mean a handful of wallets can move this chart more than any indicator can.
That is just the reality of a young token with a small circulating float, the same dynamic that was in play during the ATH surge rally earlier this year.
Source: Holder data by BscScan
Audiera Liquidation Data Shows Where The Pressure Sits
Short positions are taking the bigger hit right now. Over the past 24 hours, total liquidations hit $363.00K, with shorts accounting for $315.73K of that against just $47.28K in longs.
That kind of imbalance usually means traders were positioned against the move and got squeezed when price broke higher. Squeezes like this can extend a rally faster than fundamentals ever could.
Source: Liquidation data by CoinGlass
Audiera Technical Price Analysis: Reading The Breakout Move
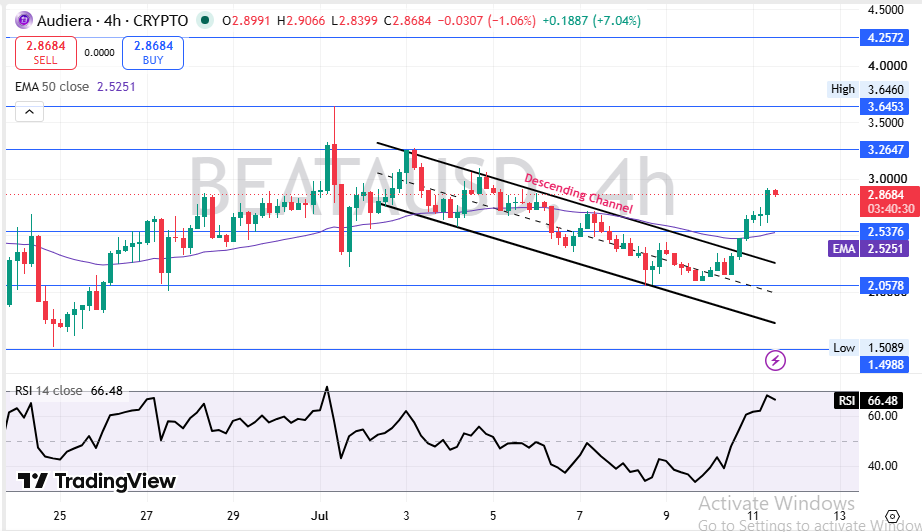
Price broke out of a descending channel that had capped Audiera. That is the real story here, not just a green candle on the chart.
Source: Charting by TradingView
The move happened while RSI climbed to 66.48, still under overbought territory, which leaves some room before momentum traders start taking profits.
Price is trading above its 50 EMA near $2.53, and that average is now curling upward. When short- and medium-term momentum agree like this, continuation becomes more likely than reversal.
But here's what most traders are missing: volume on this breakout came in heavier than the last three attempts combined. That is not a fake move. That is participation.
Audiera Trading Volume By Exchange: Where The Action Is
OKX and Binance are carrying most of Audiera's volume right now, at $113.75M and $72.60M, respectively, followed by LBank near $30.54M. Bybit and MEXC round out the next tier of activity among the crypto exchanges driving BEAT liquidity.
Source: Volume heatmap by CoinGlass
Audiera Price Prediction For The Next Few Days
In the short term, the setup favors continuation as long as the price holds above the broken channel line, in line with recent crypto price predictions across similar mid-cap tokens.
| Timeframe | Bearish Target | Base Target | Bullish Target | Key Trigger |
|---|---|---|---|---|
| 24 Hours | $2.65 | $2.90 | $3.10 | Volume holding above average |
| 3–7 Days | $2.50 | $3.05 | $3.26 | Weekly close above resistance |
| 2–4 Weeks | $2.30 | $3.20 | $4.65 | Sustained buyer follow-through |
Watch the reaction near $3.26. That level had a capped price before.
Audiera Long-Term Price Outlook Through 2027
Zooming out, Audiera still trades far below its all-time high near $11.10, and closing that gap needs more than a chart pattern. Larger names have shown what sustained conviction looks like.
| Timeframe | Bearish Target | Base Target | Bullish Target | Catalyst Needed |
|---|---|---|---|---|
| 3 Months | $2.00 | $3.50 | $5.00 | Sustained volume growth on major exchanges |
| 6 Months | $1.70 | $4.20 | $6.50 | New exchange listings and liquidity expansion |
| End of Year | $1.50 | $5.00 | $8.00 | Broader AI agent narrative strength |
| 2027 Outlook | $1.20 | $6.00 | $10.50 | Real product adoption beyond speculation |
The long-term case is not weak, but it is not proven either. Adoption has to show up in usage, not just price.
Three Audiera Price Scenarios Traders Are Watching
Worst Case: Price rejects near $3.00 and rolls back into the old channel, triggered by whale profit-taking given the extreme top holder concentration.
Base Case: Price consolidates between $2.60 and $3.20 while the market digests the breakout, the most realistic path given the current volume.
Best Case: A clean break and hold above $3.26 pulls in fresh momentum buyers and opens a run toward $3.65 and beyond.
| Scenario | Price Range | What Triggers It |
|---|---|---|
| Worst Case | $2.00 - $2.50 | Whale selling into strength. |
| Base Case | $2.60 - $3.20 | Sideways digestion after the breakout. |
| Best Case | $3.26 - $4.00 | Volume-backed continuation above resistance. |
Key Audiera Price Levels Every Trader Should Watch
Resistance zone: $3.2647, then $3.6453 above that, both from prior swing highs.
Support zone: $2.5376, the first real floor beneath the current price.
Invalidation zone: below $2.0578, a close under this level would break the bullish structure entirely.
Analyst View And Final Thoughts On Audiera Price Action
The chart setup leans bullish right now, and it would be dishonest to pretend otherwise given the channel break and volume behind it.
RSI at 66.48 still has room before hitting overbought, which supports more upside before momentum traders start pulling profit off the table.
A weekly close above $2.5376 would confirm buyers are firmly in control, not just reacting to a short squeeze.
One thing worth tracking beyond the chart: broader risk appetite still leans on the Bitcoin price, and a shift there tends to ripple through smaller tokens like BEAT fast. Whale concentration here is extreme too, and that group can flip sentiment fast if they start distributing into strength.
The most important level to watch stays $3.2647. Lose it and this move stalls out.
Momentum is real, and it fits the same story behind the broader crypto market. Just do not mistake it for certainty.
Disclaimer: This article is for educational purposes only and does not constitute financial advice. Crypto markets are volatile. Consult your investment advisor before making any investment decision.

















