Backpack Price Prediction: $BP Triangle Breakdown, Rally, What Next?


Backpack is buzzing across trading communities right now after a strong rally reversed sharply following a failed breakout attempt.
Backpack positions itself as a crypto exchange platform offering spot and derivatives trading along with its native $BP token, according to the project's own materials.
This Backpack Price Prediction looks at what this triangle breakdown could mean for $BP going forward. Stick around till the end to see what the charts are hinting at next.
Backpack Price Prediction: BP market outlook
Metric | Value |
Current Price | $0.427375 |
24h Change | -6.3% |
24h Range | $0.4186 - $0.4682 |
7 Day Change | -20.9% |
Market Cap | $106.172M |
Fully Diluted Valuation | $424.687M |
24h Trading Volume | $2.156M |
Circulating Supply | 250M $BP |
Total / Max Supply | 1B $BP |
Backpack price crash: BP Short-term chart analysis
The BP price broke down through its rising trendline and $EMA crossover (9 and 20) support and dropped sharply and started trading in the descending trendline.
$BP attempted a breakout above its descending resistance trendline, but the move failed, marked clearly as a breakout failure on the chart. 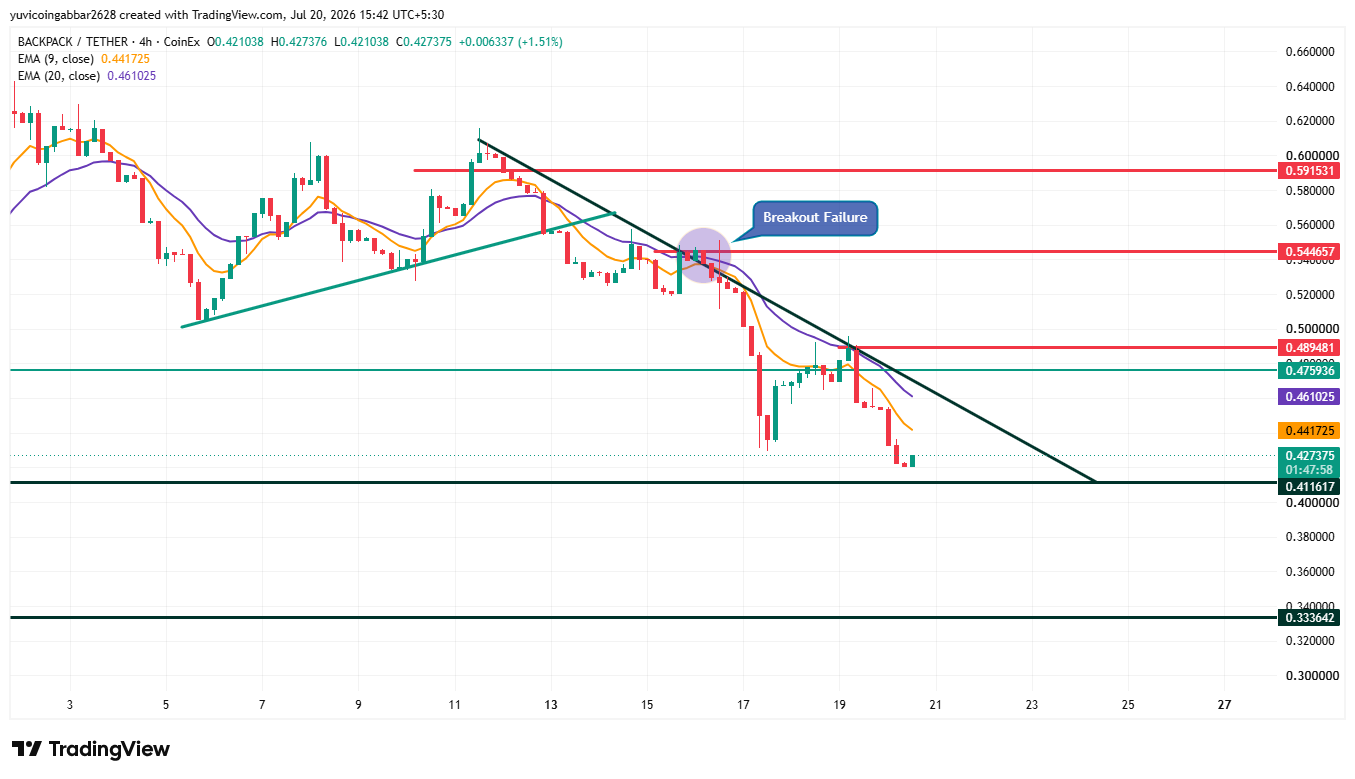
EMA 9 is at 0.441725 and EMA 20 is at 0.461025, with the price now at 0.427375, trading below both EMA lines.
$BP Short-term Important Target levels
Level Type | Price |
Resistance | $0.591531 |
Resistance (closer) | $0.544657 |
Resistance (near-term) | $0.489481 |
$EMA 20 | $0.461025 |
$EMA 9 (initial recovery level) | $0.441725 |
$0.427375 | |
First support | $0.411617 |
Deeper support | $0.333642 |
BP price prediction 2026:$BP Long-Term Chart Analysis
$BP formed a large symertical triangle pattern from early June through mid-July, building higher lows into a flat resistance zone.
Price has now broken down out of that triangle and created a bearish EMA crossover between the 9 and 20 EMAs, a bigger structural shift than the short-term picture alone. 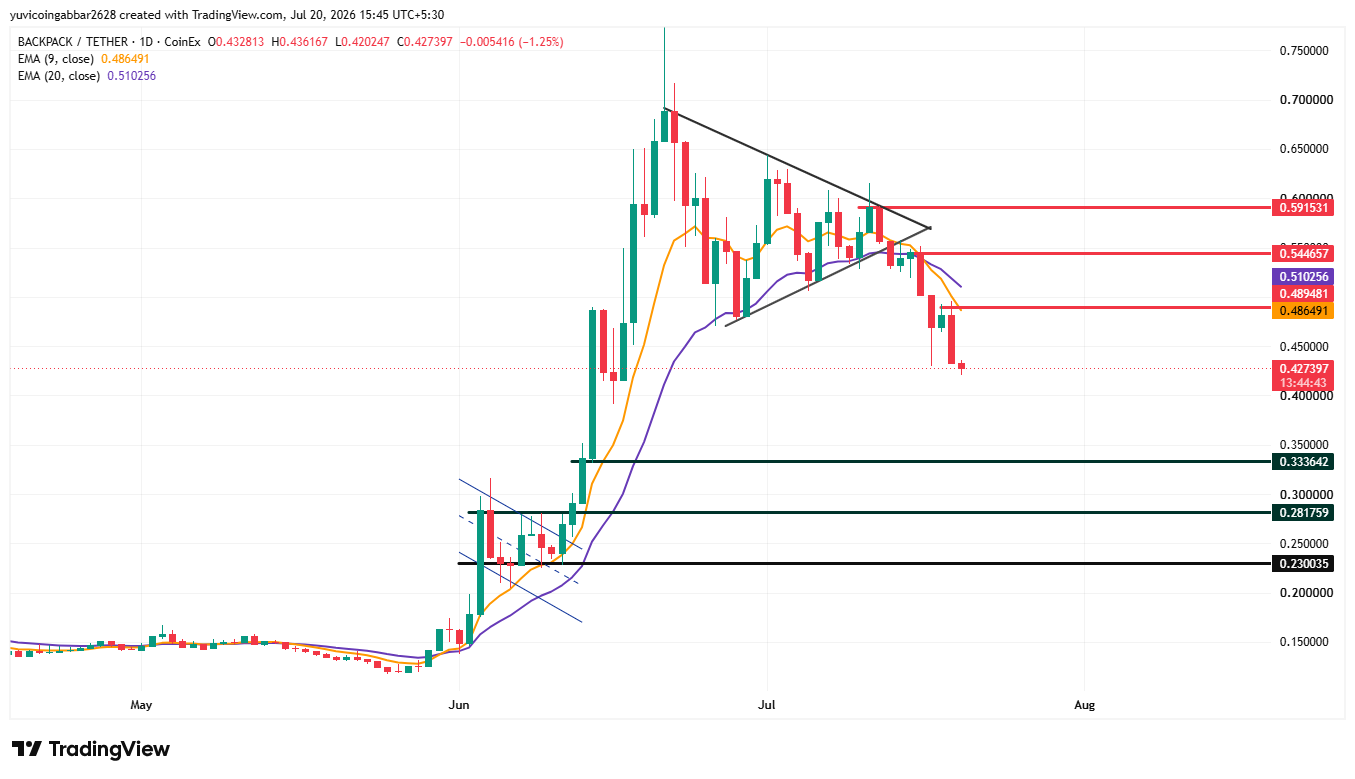
$EMA 9 is at 0.486491 and EMA 20 is at 0.510256, with the price sitting well below both EMA lines.
$BP Long-Term Target levels
Level Type | Price |
Resistance | $0.591531 |
Resistance | $0.544657 |
Resistance (closer) | $0.489481 |
E M A 20 | $0.510256 |
E M A 9 (initial recovery level) | $0.486491 |
First confirmed support | $0.333642 |
Deeper support | $0.281759 |
Deeper support (lower) | $0.230035 |
Two Reader Takeaways
For existing holders, the level to watch is the first confirmed support at $0.411617 on the short-term chart. A clean break below that shifts focus toward the deeper support at $0.333642, which lines up with both timeframes.
For anyone considering an entry, wait for $BP to reclaim the $EMA 9 at $0.441725 as an initial recovery signal, rather than entering while the triangle breakdown is still fresh.
Backpack Market Outlook Expert View
According to CoinGabbar analysts, the setup leans cautious for now, given the multi-week triangle breakdown on the daily chart.
A bullish trigger for $BP price recovery would be a close back above the $EMA 9 on both timeframes.
A bearish trigger is already partly active, with price holding below the first confirmed support levels on both charts, keeping the deeper support zones in play if selling continues.
Disclaimer: This is a technical read based on current chart structure and should not be treated as financial advice. Crypto markets are highly volatile, and a token that has already moved this sharply can continue to move sharply in either direction with little warning. Always do your own research before making any investment decision.
Also read:
















