Bitcoin Faces Historic Q4 Risk as August Curse, Yen Fears Loom


Bitcoin is trading near $64,000 this week, up modestly on the day, but the mood around the market feels far from calm.
Traders are watching several warning signs at once, and history is not exactly on Bitcoin's side heading into the final months of 2026.
This midterm year has followed a pattern crypto traders know well. Big shocks tend to hit Bitcoin hard in the back half of election-cycle years.
The Mt. Gox bankruptcy, the ICO collapse, and the FTX implosion all happened in years with similar timing. Now traders are asking if Q4 2026 could bring the next shock.
Why is August historically a weak month for BTC?
Looking at Coinglass monthly return data going back to 2013, August has closed red in 9 of the last 13 completed years. That includes four straight red Augusts from 2022 through 2025.
The average August return sits at just +1.15%, and the median is actually negative at -6.99%. This does not guarantee a repeat this year, but it does show a seasonal pattern worth watching.
Bitcoin's 2026 numbers so far are also rocky. January dropped 10.17%, February fell 14.94%, and June saw a sharp 20.48% decline. July bounced back with a 7.36% gain, and August is currently sitting at +1.54%.
What is driving fear around a Q4 Bitcoin crash?
A viral chart from trader Crypto Rover has been making the rounds. It lines up three past BTC drops with major shocks, then flags Q4 2026 with a large question mark asking "what's next."
The chart does not predict a specific event. It simply notes that Q4 of midterm years has historically brought extreme volatility to $BTC markets.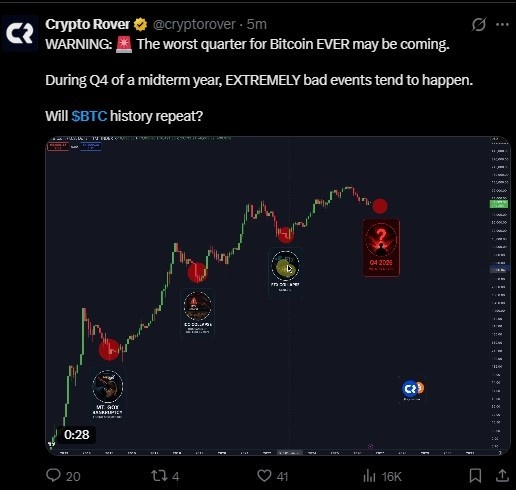
How does yen intervention affect Bitcoin price?
Another chart getting attention compares $BTC drops to USD/JPY moves. It claims every major BTC crash this year lined up with Japan defending the yen, including a 35.43% drop and a 26.28% drop shown on the chart.
The post argues that the US and Japan intervened together on currency markets for the first time in nearly 30 years. If true, some traders worry this coordinated action could pressure risk assets like $BTC again.
Currency intervention and crypto price moves are correlated in these charts, but correlation is not the same as proof of cause. Macro traders will likely watch USD/JPY closely either way.
What did Michael Saylor say about selling $BTC?
Michael Saylor, known for his "Never Sell Your Bitcoin" stance, posted a clarification this week. He said he personally has never sold a single satoshi.
But he also noted that Strategy, the public company he leads, is different from his personal wallet. Since 2020, Strategy has disclosed it may buy or sell BTC to manage capital needs.
This distinction matters. Saylor's personal conviction remains unchanged, but Strategy's corporate treasury has more flexibility than his own holdings.
BTC monthly returns snapshot (2022-2026)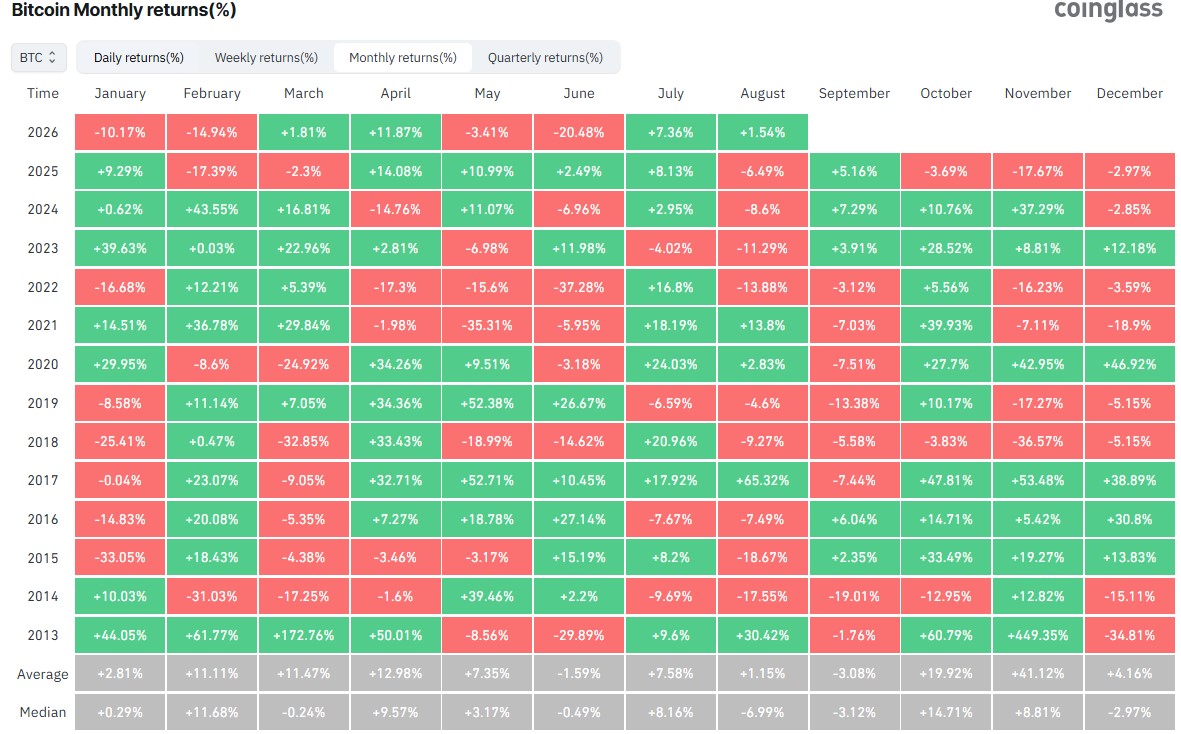
Where could $BTC price go from here?
No one can say for certain where Bitcoin heads next.
The charts and history point to caution, but Bitcoin has also broken seasonal patterns before, most notably in 2024 when August still ended weak despite a strong yearly run.
Traders watching Bitcoin price prediction models right now should weigh both the bearish seasonal data and the fact that macro conditions, ETF flows, and corporate buying can shift the picture quickly.
Q4 2026 will likely be a real test for Bitcoin's resilience, whether or not the worst-case scenario in that viral chart plays out.
Disclaimer
This article is for informational purposes only and does not constitute financial, investment, or trading advice. Cryptocurrency markets are highly volatile and risky. Always do your own research and consult a licensed financial advisor before making investment decisions.




















