Bitway Price Prediction 2026: Can $BTW Clear $0.19 Next?


A small BSC token just quietly finished carving out a multi-month base, and almost nobody outside its own chart noticed until the candle closed green. No hype thread started this one. No influencer called it first. What actually moved was volume, and that rarely lies. Does this hold, or does it fade the way most of these do once the early buyers cash out?
BTW Chart Pattern Just Broke, But The Wallet Map Tells Different Story
This bitway price prediction opens with a pattern, not a headline. Something has been building underneath $BTW for weeks, quietly, the kind of setup that only shows up once you zoom all the way out.
Traders who caught it early are already asking whether it holds.
And traders who missed it are asking something else entirely: whether it is too late to matter.
What tips this from a normal squeeze into something worth watching is what sits underneath the chart, in the wallet data most people never open. That part changes the read completely.
So where does BTW actually stand right now, and what would break the setup?
Key Takeaways
BTW trades near $0.1183, up 31.89% in 24 hours per CoinMarketCap, still 38.03% below its June 2026 all-time high.
Weekly RSI reads 72.83, already inside overbought territory after a rounded bottom breakout.
Top 100 wallets hold 99.87% of tracked supply, with one unlabeled wallet alone holding 78%.
Invalidation for the bullish case sits under $0.0783 on the short-term chart.
Why BTW Is Moving Today
BTW trades near $0.1183 after CoinMarketCap data logged a move of more than 31% in a day. The weekly chart shows why. A rounded bottom, the slow curved recovery pattern that forms after a long grind lower, just resolved above its neckline near $0.061.
Here's the thing: this was not a one-candle spike. The move followed weeks of higher lows.
Futures desks noticed too, and short positions took the brunt of it, not unlike the pattern covered in the BTW short squeeze breakdown.
BTW Technical Analysis: 4-Hour Chart
On the short-term chart, $BTW sits at $0.1186 inside a rising ascending channel, the kind of pattern where price bounces between two upward-sloping trendlines instead of a flat range. That channel dates back to late July, and every dip since has been bought before it reached the lower rail.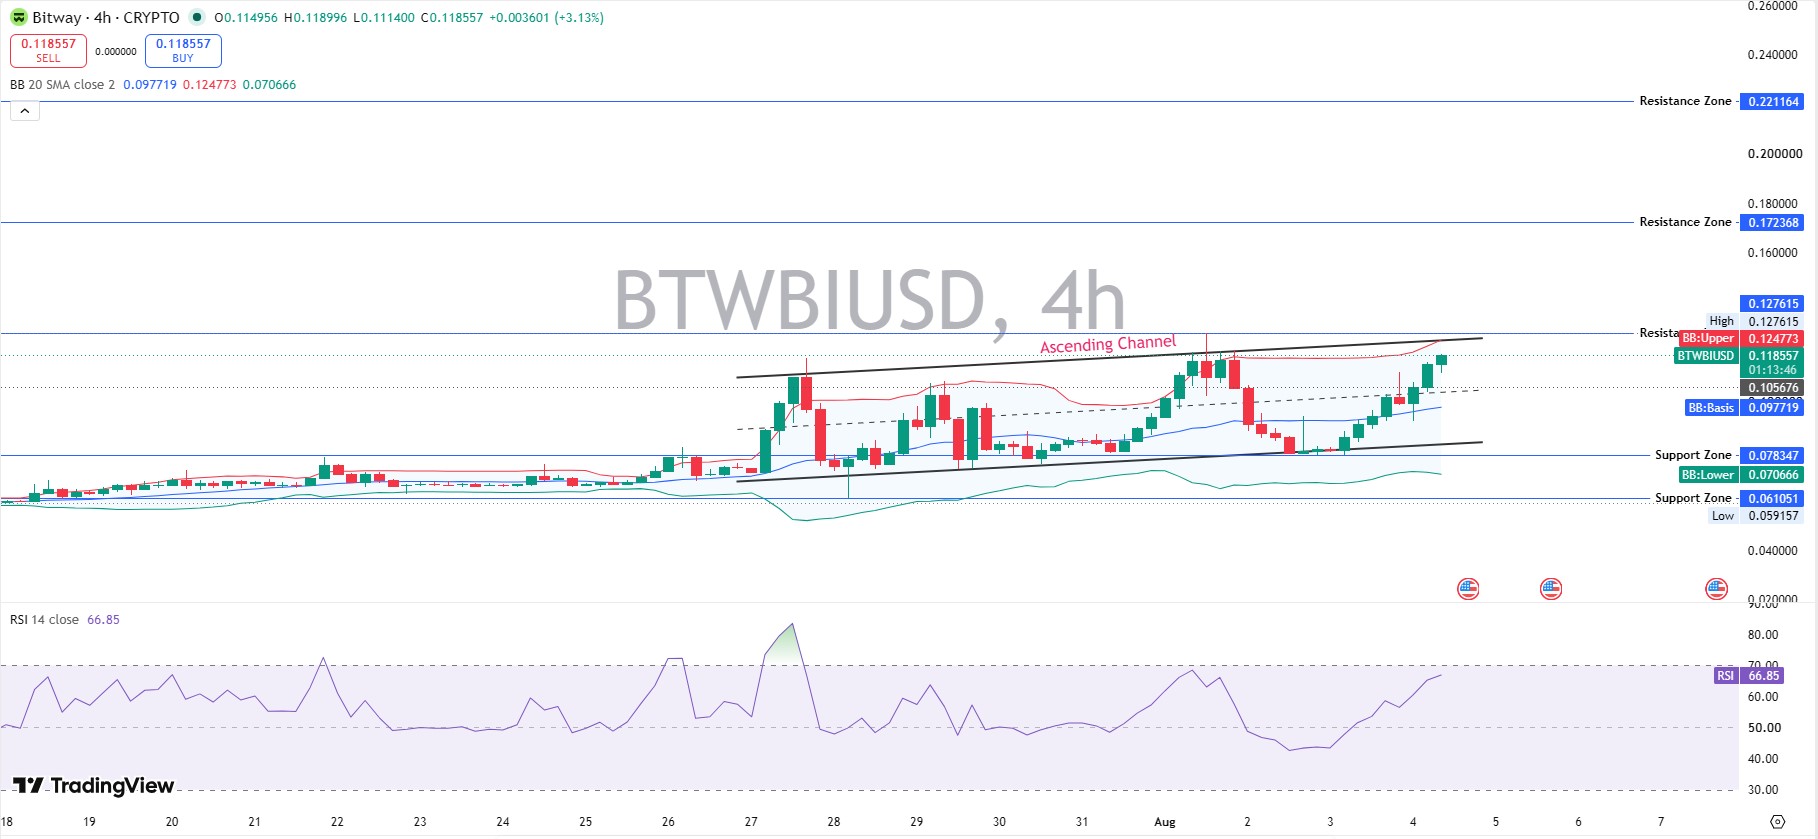
Price pushed through the mid-channel basis near $0.0977 in the last few sessions and has held above it since. That is a small tell. It means buyers are stepping in earlier each time, not waiting for the cheapest possible entry.
Resistance stacks at $0.1276 first, the upper Bollinger Band, and the ceiling of the current channel. Above that sits $0.1724, then $0.2212 further out.
Support holds at $0.0783, with a firmer floor at $0.0707 marked by the lower Bollinger Band. A deeper cushion sits at $0.0611 if both of those give way.
Four-hour RSI reads 66.85, warm but not maxed out yet, since anything above 70 usually signals an asset is overbought and due for a cooldown. A close above $0.1276 keeps the channel intact and opens room toward $0.1724. Losing the channel's lower rail would flip this short-term read bearish fast.
BTW Technical Analysis: Weekly Chart
Zoom out and the story gets bigger. $BTW trades the week at $0.1184, up 47.51%, after carving out what chart readers call a rounded bottom, a slow, curved recovery that looks like a U rather than a sharp V. That shape usually means accumulation happened gradually, not in one panic buy.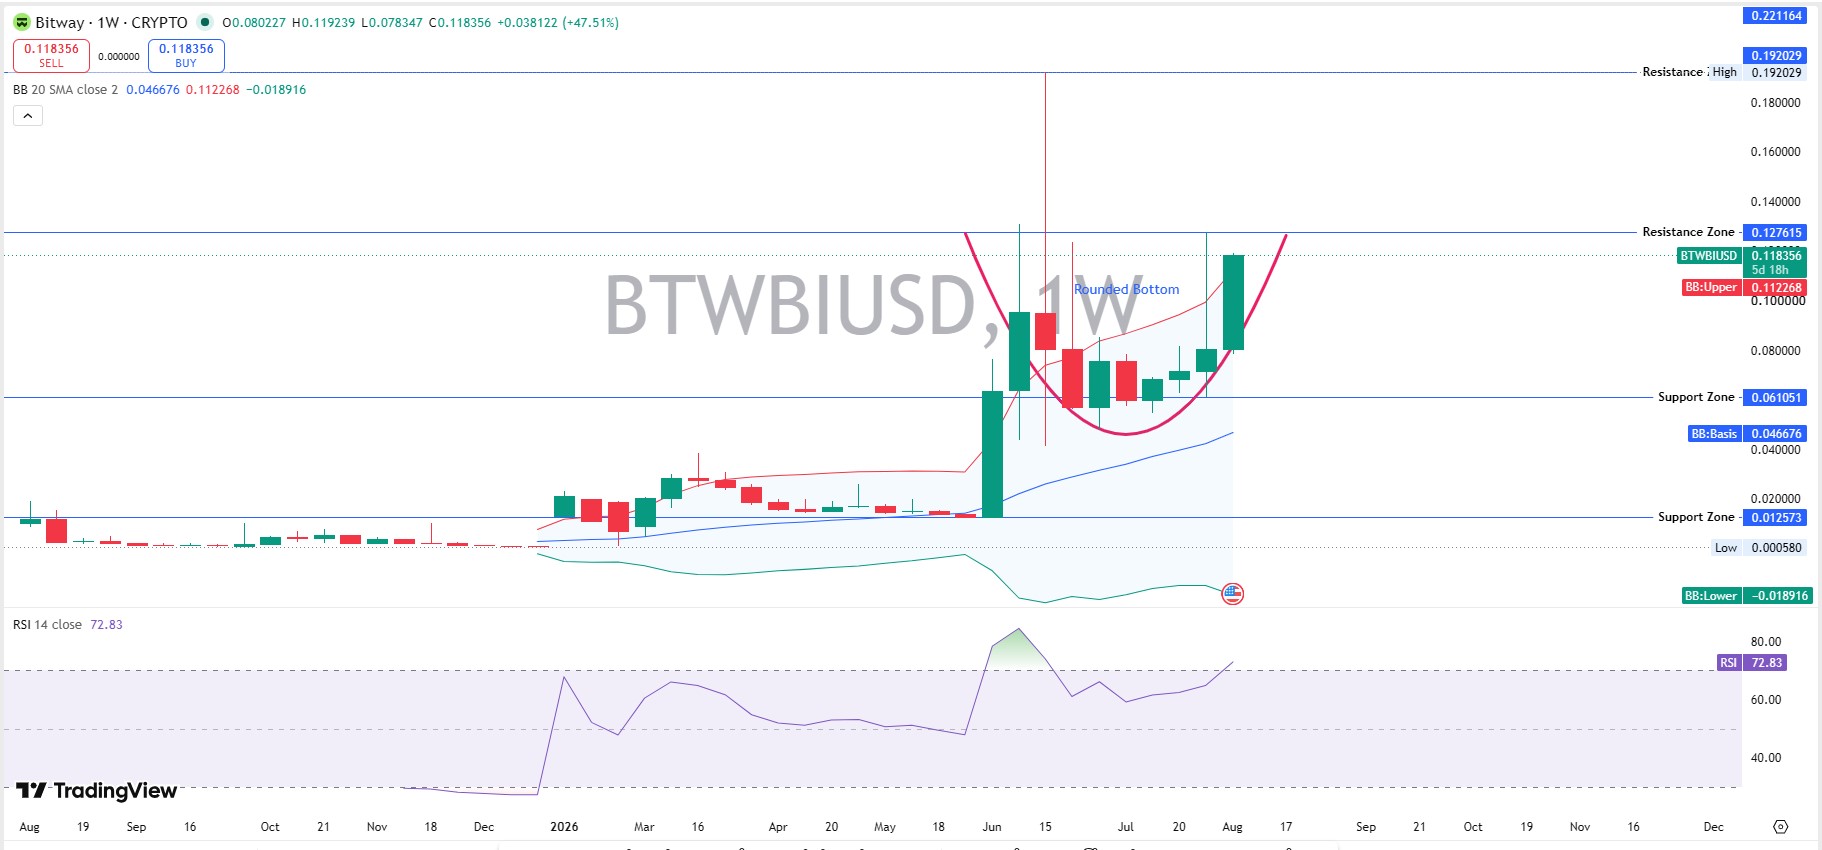
Weekly resistance sits at $0.1276 first. Above that, the prior high near $0.1920 becomes the next real test.
The weekly RSI at 72.83 is already stretched, meaning this bounce has run hot fast on the higher timeframe even though the shorter 4-hour chart still has some room left. That gap between the two RSI readings is worth sitting with. It usually means the next move gets decided by whether short-term buyers can keep pace with a weekly trend that is already tired.
BTW Support And Resistance Levels
Immediate support: $0.0783, then $0.0707, then $0.0611.
Immediate resistance: $0.1276, then $0.1724, then $0.1920, then $0.2212.
BTW Price Prediction: Scenarios By Timeframe
Timeframe | Bull Case | Base Case | Bear Case |
24H | Holds above $0.1186, tests $0.1276 (moderate) | Chops $0.11-$0.13 (high) | Slips under $0.0783 (low) |
7D | Close above $0.1724 opens $0.1920 (low-moderate) | Range-bound under channel resistance (high) | Weekly close under $0.0707 (moderate) |
Aug 2026 | Breaks $0.1920, retests $0.2212 (low) | Drifts $0.09-$0.15 tracking volume (moderate) | Falls back to $0.0611 support (low-moderate) |
Invalidation for the bullish bitway price prediction is a close under $0.0783.
Tokenomics And Whale Concentration
The circulating supply sits near 2.2B, BTW, against a 10B max supply, per CoinMarketCap tracking data, giving a market cap near $260.38M and an FDV near $1.18B. Liquidity-to-market-cap runs thin at 0.56%.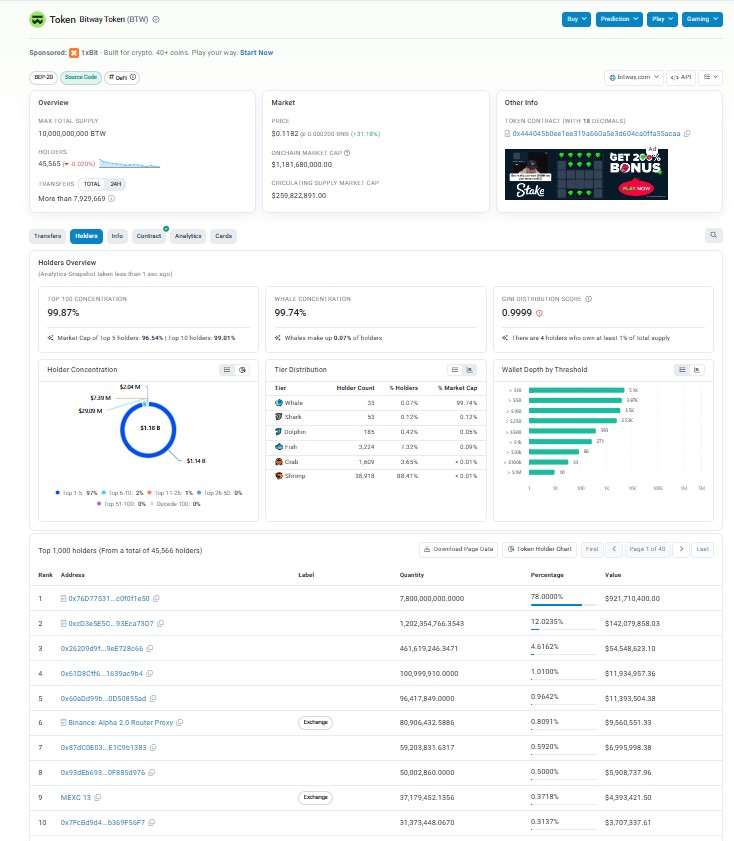
On-chain concentration runs extreme. Top 100 wallets hold 99.87% of tracked supply, and the Gini score reads 0.9999, about as skewed as a distribution gets.
One unlabeled wallet on BscScan holder records holds 78% of the tracked top holder supply alone. That single fact should shape how anyone reads this bitway price prediction.
Binance's Alpha 2.0 router wallet holds 0.81%, and MEXC's wallet holds 0.37%, both labeled exchange addresses rather than individual holders.
Liquidations And Exchange Volume
Per CoinGlass liquidation data, 24-hour liquidations hit $274.93K, split between $68.42K in longs and $206.51K in shorts. Shorts absorbed most of the damage.
Binance carries the heaviest futures volume at $75.37M, with Bybit near $16.93M and MEXC around $8.99M.
That is a real derivatives market forming around a token most traders had not opened before this week, and it sits alongside broader risk sentiment shaped by macro catalysts like the Fed rate decision.
BTW And The DeFi Altcoin Narrative
BTW sits inside the wider BSC DeFi altcoin group, tokens tied to on-chain finance rails rather than a single app or exchange listing. That framing tends to pull in buyers whenever broader altcoin risk appetite improves.
Compared to majors, small-cap DeFi names like BTW see outsized swings both ways. A rally this sharp on a market cap under $300M does not automatically confirm a trend reversal, a pattern also visible in the Binance wallet staking coverage.
Majors still set the tone for risk appetite across this group, so it is worth checking the current bitcoin price prediction alongside BTW before sizing any position.
BTW Market Outlook: Risks To Watch
Whale concentration tops the list here, and it is not a small risk. A 78% single-wallet position means one transfer could reshape the entire order book.
And RSI on both timeframes already sits warm, which raises the odds of a sharp pullback before any fresh leg higher.
Broader crypto headline risk matters too. Coverage on policy shifts like the Clarity Act developments tends to move small-cap altcoins fast, $BTW included.
New venues and thin order books can also exaggerate moves like this, so exchange listing trackers are worth a glance.
Ongoing crypto news coverage tends to flag sentiment shifts before they hit the chart.
Methodology: Chart levels came from BTW/USD weekly and 4-hour charts on TradingView charting tools, using RSI-14 and 20-period Bollinger Bands, captured on August 4, 2026, around 09:00 UTC. Price, supply, and market-cap data came from CoinMarketCap, captured the same day around 09:00 UTC. Holder and Gini concentration data came from BscScan wallet tracking for contract 0x444045b0ee1ee319a660a5e3d604ca0ffa35acaa. Liquidation and volume figures came from CoinGlass.
Disclaimer: This is speculative market commentary, not financial or investment advice. Crypto assets are volatile and can lose most or all of their value. Verify live figures before trading.


















