Algorand Price Prediction: $ALGO Truth Behind Trap, Buyers Must Watch?

Algorand is a proof-of-stake layer-1 blockchain built for fast, low-cost transactions, according to its own project materials.
This Algorand Price Prediction looks at whether this breakout holds over the next one to two weeks, a bullish case that stays intact above $0.083927, while a close back below that level would put the breakout in doubt.
Here's what the chart and network data show.
Algorand Price Prediction Today: Market Overview
Metric | Value |
Price | $0.088807 |
24h Change | 6% up |
Market Cap | $797.33M |
FDV | $888.98M |
24h Volume | $43.12M |
Vol/Mkt Cap (24h) | 5.39% |
Total Supply | 10B ALGO |
Max Supply | 10B $ALGO |
Circulating Supply | 8.96B $ALGO |
Source: Data from CoinMarketCap as of 4/08/2026. Figures may vary slightly across other tracking websites.
Algorand Network Fundamentals: Supply, Accounts, and Activity
Beyond the chart, Algorand's on-chain fundamentals give a broader read on network health, starting with how its token supply is structured.
ALGO Crypto Forecast: Supply and Lock-Up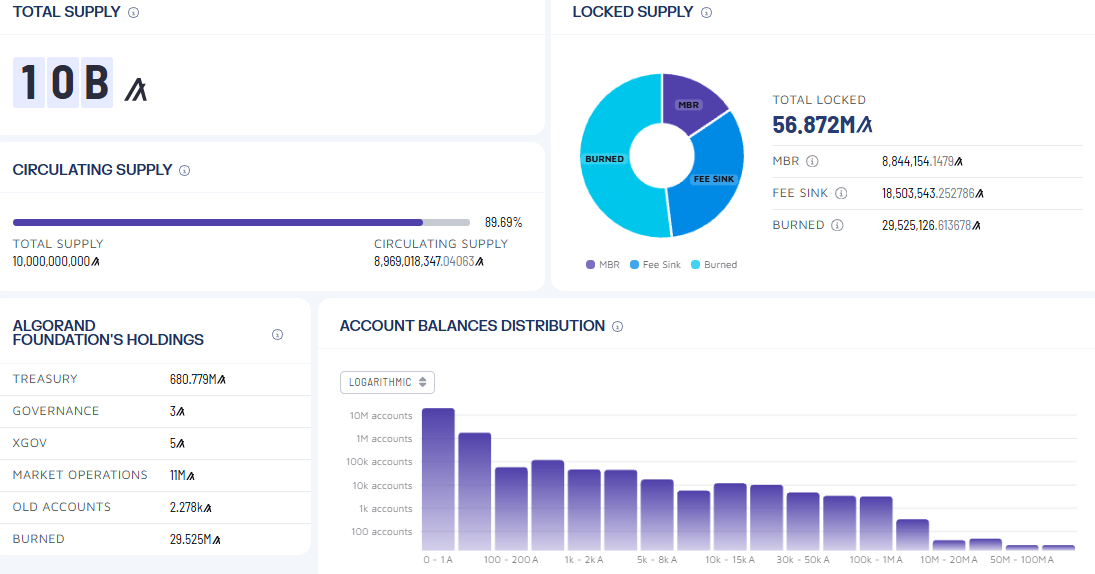
Algorand's total supply stands at 10B ALGO, with 8.97B ALGO (89.69%) already in circulation. Of the remaining supply, 56.872M ALGO is locked across the Minimum Balance Requirement (8.84M), Fee Sink (18.5M), and Burned (29.53M) categories.
The Algorand Foundation's treasury holds 680.779M ALGO, while governance and market operations allocations are minimal by comparison.
Account balance distribution skews heavily toward small holders, with the largest concentration sitting in the 0 to 1 ALGO range.
ALGO Crypto Forecast: Account Growth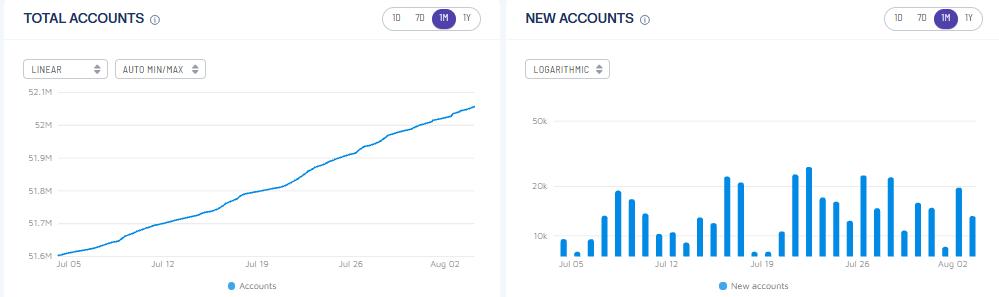
Total accounts on the network have grown steadily from 51.6M to just above 52.1M over the past month.
New account creation has been bursty rather than linear, with daily spikes above 20K on several occasions, including a peak above 25K in late July, alongside quieter stretches below 5K.
ALGO Crypto Forecast: Transaction Activity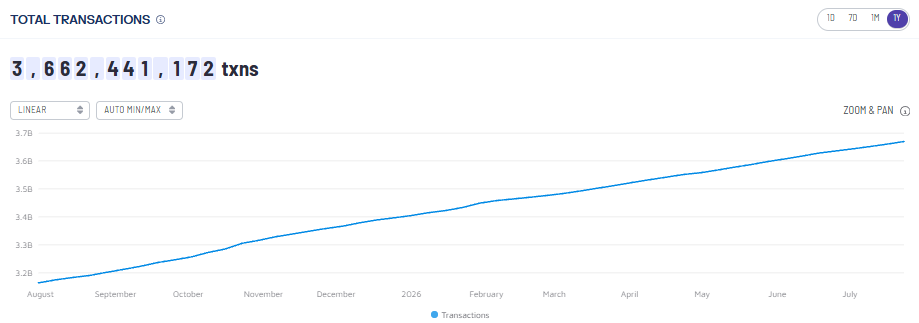
Algorand has processed over 3.66B total transactions to date, with the 1-year chart showing a steady, near-linear climb from around 3.2B in August 2025. 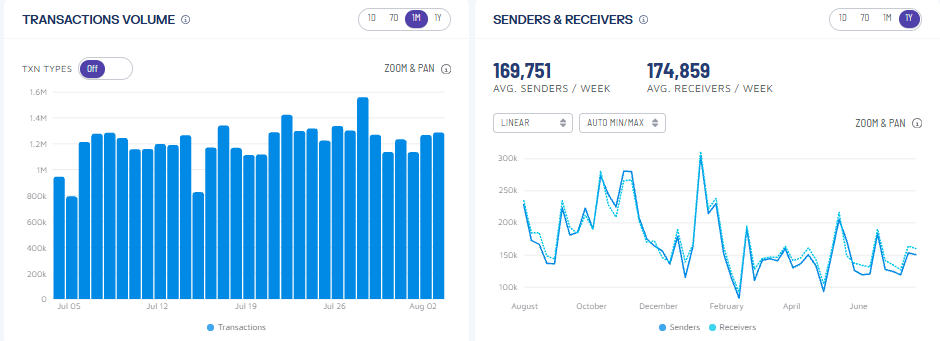
Monthly transaction volume has ranged between roughly 800K and 1.6M per day, with a spike above 1.5M in late July.
Weekly active senders and receivers have averaged around 169.75K and 174.86K, respectively, over the past year, with sharp swings, including a spike toward 300K around February.
ALGO Price Prediction Chart: Technical Analysis
Pair: ALGO/USD · Market: Spot (Crypto) · Timeframe: 4H · Source: TradingView · Timestamp: August 4, 2026, 10:43 UTC+5:30
ALGO is trading at $0.088807, after breaking down a descending triangle pattern that had capped the price since late June.
The triangle's upper resistance rejected rallies near $0.0940 to $0.0960, while a flat horizontal base near $0.081744 held as the floor.
Price pushed to a fresh low around $0.0757 in late July before reversing sharply, clearing both the trendline and the horizontal base in one impulsive move that touched a high of $0.091152.
This structural breakout is kept distinct from the EMA (Exponential Moving Average, a momentum indicator that weights recent candles more heavily) picture below.
The shorter EMA at $0.085018 has crossed above the longer EMA at $0.082837, both now sitting beneath the current price and reinforcing the price as a genuine short-term bullish momentum shift rather than a single volatile candle.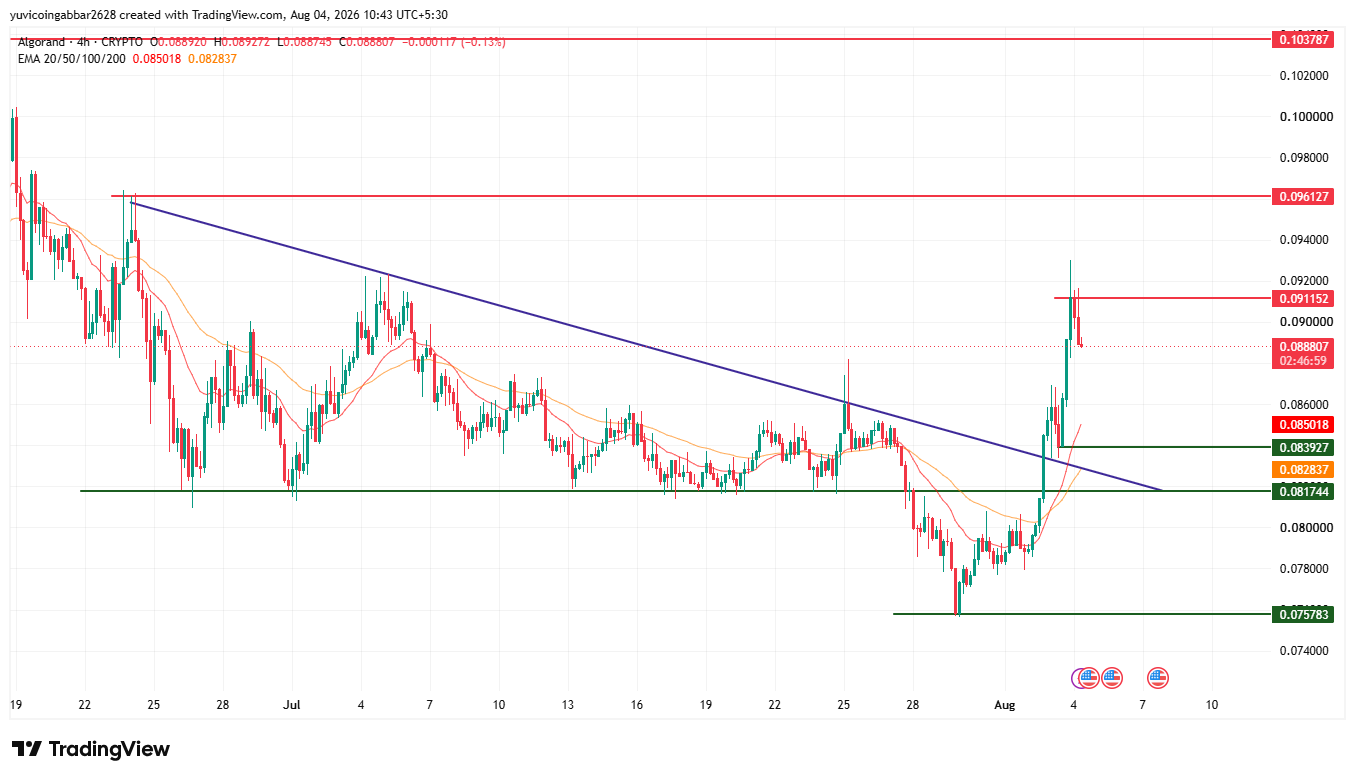
Level Type | Price |
Resistance 3 | $0.103787 |
Resistance 2 | $0.096127 |
Resistance 1 (nearest) | $0.091152 |
Immediate Price Reference | $0.088807 |
EMA (20) | $0.085018 |
First Support (former triangle base) | $0.083927 |
EMA (50) | $0.082837 |
Deeper Support | $0.081744 |
Structural Floor | $0.075783 |
Algorand Forecast: Bull Case vs. Bear Case
ALGO price target 2026 Bull case: Holding above the descending triangle base at $0.081744 and the EMA cluster near $0.082837 to $0.085018 would keep the breakout structure intact.
A confirmed move above $0.091152 would open the path toward $0.096127 and eventually $0.103787.
ALGO price target 2026 Bear case: A close back below $0.083927 would put the breakout in doubt and suggest a false move above the triangle.
Losing the deeper support at $0.081744 would expose $0.075783, the recent monthly low, as the next downside level.
What Could Invalidate the Bullish Setup?
A rejection at $0.091152 followed by a close back below the decending triangle base at $0.081744 would put the breakout in question.
A deeper break below at $0.075783 would undermine the reversal structure entirely and reopen the prior downtrend.
Algorand Price Prediction Methodology
This forecast draws on multiple inputs rather than a single chart pattern: the descending triangle breakout, the bullish EMA crossover, on-chain account and transaction growth, and broader market structure.
No single signal here is treated as decisive on its own.
Algorand Price Prediction 2026: Expert View
According to CoinGabbar analysts, the breakout above the descending triangle, paired with the bullish EMA crossover, is a meaningful shift after weeks of lower highs.
What strengthens the case further is that this move comes alongside steady account growth and a near-linear rise in total transactions, suggesting the network's underlying usage has kept climbing even while price-chopped lower.
The $0.083927 to $0.085018 zone is now the key battleground: holding it keeps the breakout thesis alive, while losing it would suggest buyers got trapped chasing the initial move.
Algorand Price Prediction: Data Sources
Price, EMA, and chart pattern data referenced from a 4H ALGO/USD chart via TradingView, timestamped August 4, 2026, 10:43 UTC+5:30. Market cap, FDV, volume, and supply data referenced from CoinMarketCap. Supply lock-up, account growth, and transaction activity data referenced from on-chain Algorand network analytics.
Disclaimer: This piece is for informational purposes only and isn't financial advice. The levels and scenarios above are based on technical chart analysis and publicly available data at the time of writing, and crypto markets can move sharply within hours, so past patterns don't guarantee future outcomes. It's worth doing independent research and considering your own risk tolerance before acting on any of the levels discussed here.


















