Bitcoin Golden Cross Is Here, What Next for BTC as Fed Decision Looms?


Bitcoin is sitting near $78,400 this week, caught between a bullish chart signal and a nervous bond market. The Bitcoin golden cross just triggered, but a looming Fed rate decision is keeping traders on edge.
BTC has continued to hold the line at $76,000 despite bears calling for a selloff. So far, this does not look like a dead cat bounce.
Here is what the charts, the options market, and on-chain data are saying right now.
What is Bitcoin's price today?
BTC changed hands around $78,425 as of this writing, down about 1.65% since midnight UTC, according to CoinMarketCap data.
On the daily chart, price is consolidating inside a narrow rising channel after August's strong rally. The 50-day average has just crossed above the 200-day average. Traders call this a golden cross.
What is a golden cross in Bitcoin trading?
A golden cross is simple. It just means short-term momentum has caught up to the long-term trend.
But history is mixed here. This signal has fired 12 times in Bitcoin's past.
Only three of those crosses stayed valid for a full year. Those three delivered a huge average return of 250% over 12 months.
The other nine, measured over three months, averaged a smaller 24.9% gain. In plain terms, the golden cross has failed more often than it has produced a lasting rally.
Will Bitcoin break $82,000 resistance?
This is the real test right now. US spot Bitcoin ETFs pulled in $986.7 million of net inflows between August 31 and September 4.
That is a lot of demand. Yet it was not enough to push BTC through the $82,614 resistance line.
That level sits inside a wider $81,500 to $84,400 zone built from May's highs. Until Bitcoin closes a full day above it, the range stays intact.
Options data backs this up. Adam Haeems of Tesseract Group described the current setup as a hedged long position, not a defensive one.
Roughly $1.4 billion in September puts are stacked between $68,000 and $75,000 on Deribit. Call open interest from $82,000 to $100,000 is even bigger. Traders are protecting downside while still betting on upside.
Bitcoin price levels to watch
Level | Price Zone | Meaning |
Support | $75,000 - $76,000 | First downside test; bulls need to defend this |
Resistance | $81,500 - $84,400 | May high zone, key breakout area |
Bull target | $86,000 - $88,000 | Possible move if $84K clears |
Bear target | $70,000 - $72,000 | Possible move if $75K breaks |
A daily close above $84,000 would open the door toward $86,000 to $88,000, with $90,000 as the next psychological marker. A break below $75,000 could send price back toward $70,000 to $72,000. This is a technical scenario, not a certainty.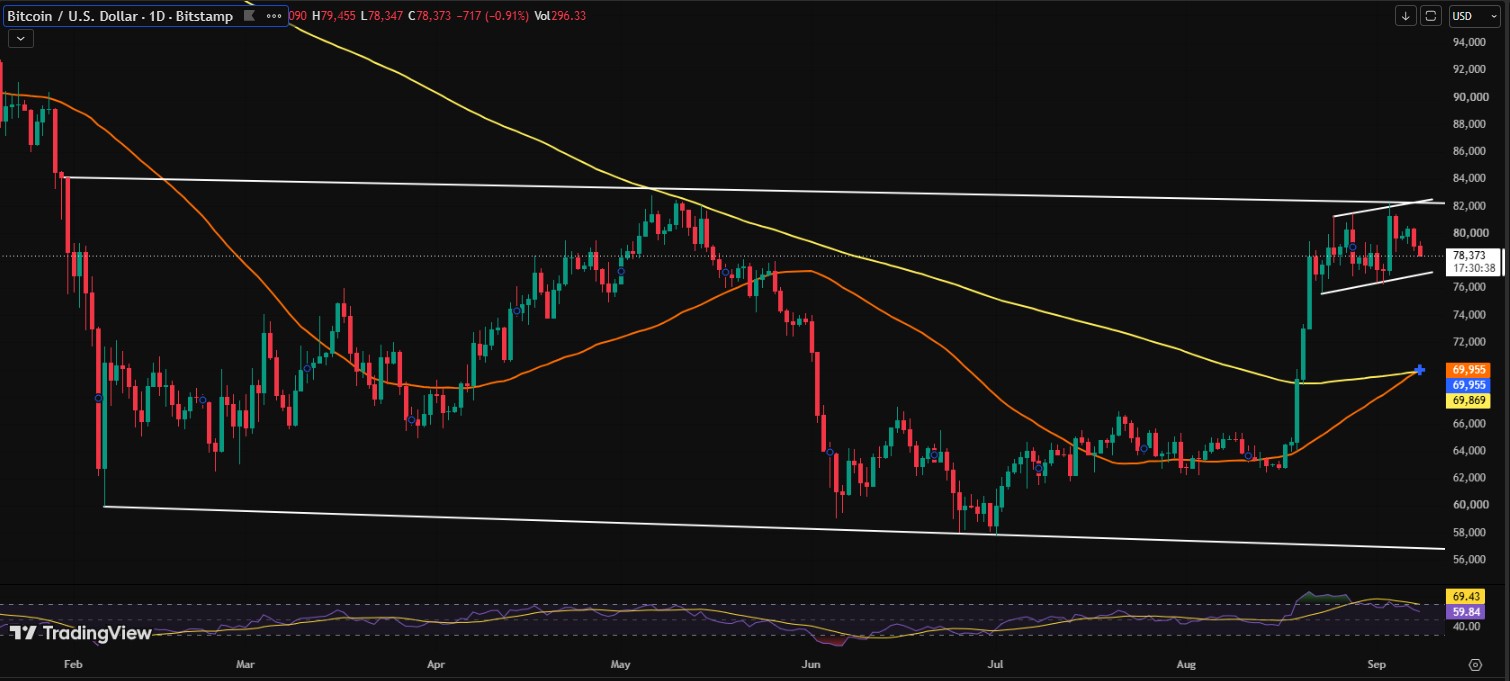
Will the Fed rate decision affect Bitcoin price?
The Fed meets on September 16, 2026. Markets now price a 58.4% chance of a rate hike to 375-400 basis points. That is up sharply from just 34.6% a week earlier.
Higher rates usually pull money away from riskier assets like Bitcoin. This growing hike expectation is a big reason traders are staying cautious near resistance.
A Senate CLARITY vote is also expected in the coming two weeks, adding another layer of uncertainty for crypto markets.
How does Bitcoin leverage affect price swings?
Last week offered a clear lesson on how leverage works. On September 3, a dovish comment from Fed Governor Waller sent BTC from about $77,300 to $81,300.
Leverage followed fast. Coin-denominated open interest jumped 8,204 BTC in a single day, according to Santiment Intelligence data.
Then the August payrolls report landed on September 4, far above forecasts. Positioning unwound quickly. Open interest fell over the next three days by roughly 21,042 BTC.
Yet price barely gave back ground. It stayed close to $3,000 higher than where it started. That is the real story. Leverage moved first, but price kept going without it.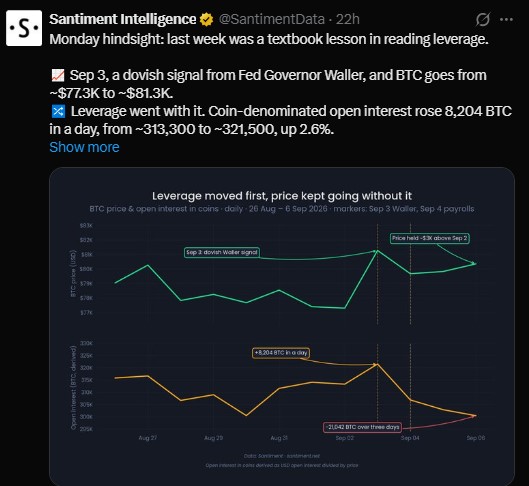
Did the Liquid hack affect Bitcoin price?
Not much, and that is notable. On September 6, about 4,000 BTC, worth close to $320 million, was drained from Blockstream's Liquid federation through a bug in its Elements software.
That is roughly 95% of Liquid's reserves. It was the loudest crypto headline of the week.
Yet Bitcoin sentiment barely moved, shifting by only about five points based on Santiment's sentiment balance data.
Compare that to the Coldcard seed flaw discovered on August 1. Reported losses there were less than half of Liquid's dollar size, yet sentiment swung by 570 points.
The difference seems to come down to proximity. Coldcard's bug touched individual user keys directly. Liquid's exploit hit a federated wallet system, further removed from everyday holders.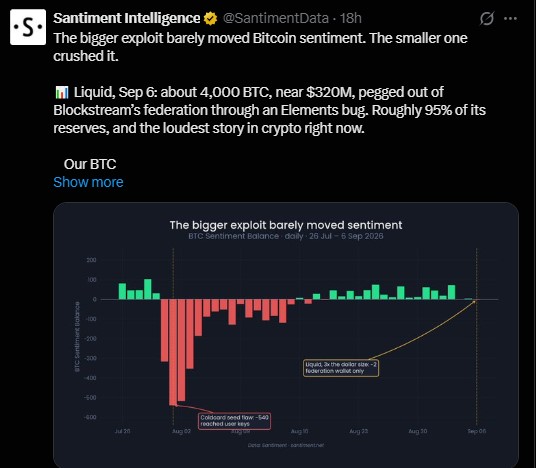
Bottom line for Bitcoin price action
Bitcoin remains in a holding pattern. ETF demand is steady, and the golden cross is a mild long-term positive signal.
But options positioning shows traders are hedged, not fully confident. The Fed decision on September 16 looks like the next major catalyst.
Watch $75,000 on the downside and $84,000 on the upside. Whichever level breaks first will likely set the tone for the rest of September.
Disclaimer
This article is for informational purposes only and does not constitute financial, investment, or trading advice. Cryptocurrency markets are highly volatile and carry significant risk of loss. Past performance, including historical golden cross data, does not guarantee future results. Always do your own research and consult a licensed financial advisor before making investment decisions.
Also read:
1 month ago
I invested in bitcoin trading After losing $78.4 USDT) linked to a romance fraud scam worth of cryptocurrency through an online investment platform and later discovered it was a scam. After extensive research for recovery options, I contacted CAPITAL CRYPTO RECOVER based on positive client reviews and recommendations. Their professional security team guided me through the recovery process using advanced technology, and I was able to recover my lost cryptocurrency successfully. I am truly grateful for their support and assistance during such a difficult experience. I will advise you to contact CAPITAL CRYPTO RECOVER helped me recover my funds. For anyone facing similar issues, Website: https://recovercapital.wixsite.com/capital-crypto-rec-1 Email: Capitalcryptorecover@zohomail.com Telegram: @Capitalcryptorecover Contact: Recoverycapital@fastservice.com WhatsApp/Text Number: +1 (336) 390-6684


















