Bitcoin Price Prediction: BTC Hits $80K, Will It Break $83K Soon?


Bitcoin broke above $80,000 on Monday for the first time since May 2026. The move caps a sharp rebound after months of heavy selling pressure.
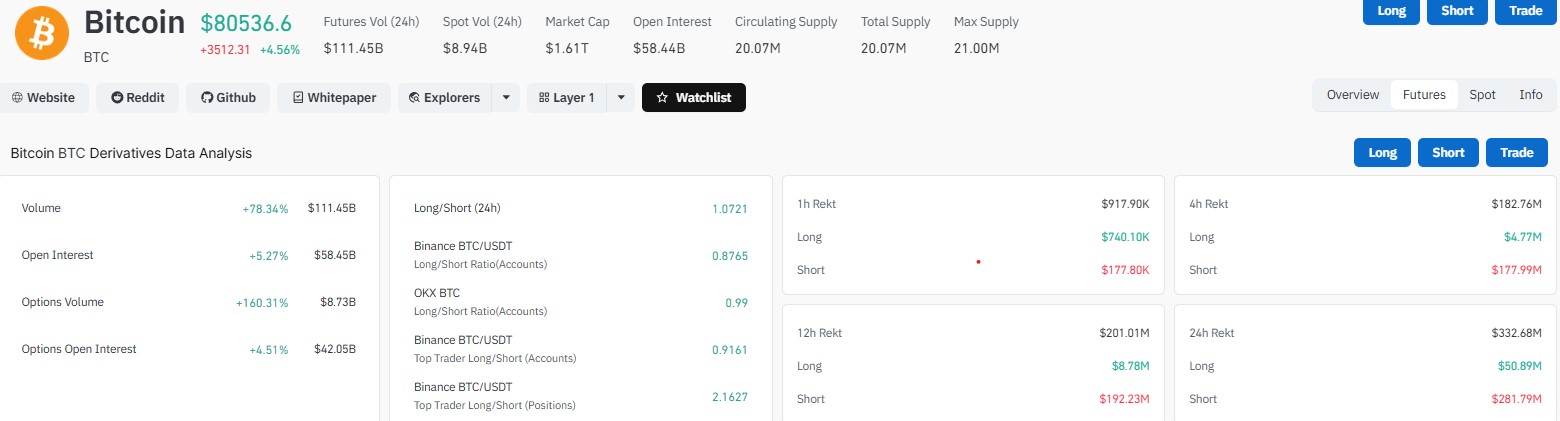
BTC was changing hands near $80,536 at the time of writing, up 4.56% over the past 24 hours. The rally has reignited talk of a fresh Bitcoin bull run, but traders are split on whether the gains can hold.
Why is Bitcoin price above $80,000 today?
Several forces lined up at once. U.S. spot Bitcoin ETFs pulled in $337.56 million in net inflows on August 24, based on CoinGlass data. BlackRock's IBIT fund alone brought in $209 million.
Over the past six trading days, total ETF inflows have reached $2,255.35 million. That kind of steady buying has helped push Bitcoin price higher and squeezed traders who had bet on further declines.
Short sellers took the brunt of the damage. Liquidation data from CoinGlass shows 95,843 traders were wiped out in the past 24 hours, with total liquidations hitting $646.84 million.
A narrower 24-hour reading on the CoinGlass dashboard put liquidations at $332.68 million, split between $281.79 million in short positions and $50.89 million in longs.
The gap between the two figures likely comes from different exchange sample sets, but the direction is the same either way: short sellers took the bigger hit.
Zooming in further, the last 4 hours alone saw about $182.76 million in liquidations, with $177.99 million of that coming from short positions and just $4.77 million from longs. That is a lopsided ratio and points to a fast, forced short squeeze rather than a slow grind higher.
The single biggest liquidation order landed on Bitget, a $103.54 million BTCUSDT position.
Bitcoin liquidation snapshot
Metric | Value |
24h Total Liquidations (broad) | $646.84 million |
24h Total Liquidations (narrow) | $332.68 million |
24h Short Liquidations | $281.79 million |
24h Long Liquidations | $50.89 million |
4h Total Liquidations | $182.76 million |
4h Short Liquidations | $177.99 million |
4h Long Liquidations | $4.77 million |
Traders Liquidated (24h) | 95,843 |
Futures Volume (24h) | $111.45 billion |
Open Interest | $58.45 billion |
Largest Single Order | $103.54 million (Bitget) |
What does the 1,130-day SMA mean for Bitcoin?
BTC also reclaimed its 1,130-day simple moving average on August 20, after breaking above $74,000. This is a long-term trend line that has marked the end of past bear markets over the last four Bitcoin cycles.
$BTC fell below this line on June 1, 2026, and spent 80 days trading under it, a stretch many analysts read as oversold.
Reclaiming the level does not guarantee a new bull market, but history shows it has lined up with early bull phases before.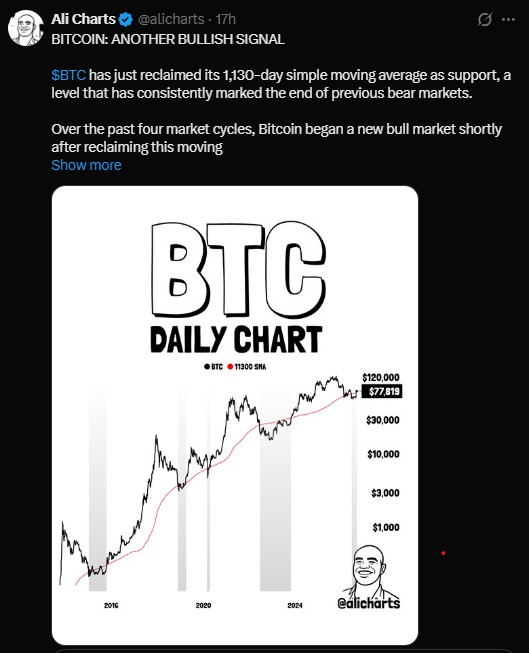
What are analysts saying about Bitcoin's next move?
BitMEX co-founder Arthur Hayes argued in a recent essay that Treasury Secretary Scott Bessent's expansion of longer-dated Treasury buybacks is pumping more dollar liquidity into markets.
Hayes believes risk assets like Bitcoin tend to benefit first from that kind of liquidity.
He outlined a scenario where the Treasury leans toward yield-curve control if the 10-year yield tops 5%. A more likely path, he said, involves bigger buybacks and gradual use of close to $1 trillion sitting in the Treasury General Account.
Hayes called this the start of a new bull market, though he expects sharp volatility along the way. His fund, Maelstrom, is now positioned at what he described as maximum risk, with exposure spread across BTC, ETH, ENA and ETHFI.
Separately, market odds of Bitcoin trading above $100,000 before year-end have climbed to 29% following last week's rally, according to prediction market data.
Not everyone is convinced the breakout is confirmed. Traders using Smart Money Concepts point to a bearish order block sitting between $80,000 and $83,000, an area that also lines up with the most recent lower high on the daily chart.
Under that view, the price needs a strong daily close and acceptance above $83,000 to invalidate the bearish structure. A simple wick above the zone would not be enough.
Rejection from this range could send price back toward $70,000, $60,000, or even $50,000 in a deeper pullback.
If Bitcoin does close and hold above $83,000, chart watchers following this method would look for a retest, or mitigation, of that same order block.
A higher low forming after that retest would count as a bullish change of character, often called a CHoCH in trading shorthand, and would strengthen the case for a real trend reversal.
Until that sequence plays out, this bounce is being read by some as a move into a premium price zone within a larger downtrend, not a confirmed reversal.
Is now a good time to buy Bitcoin?
That is a personal decision that depends on risk tolerance, time horizon, and portfolio goals. The setup here is mixed. ETF demand and the long-term moving average reclaim favor the bulls. The $80,000 to $83,000 order block and elevated leverage in derivatives markets favor caution.
Open interest of $58.45 billion alongside $111.45 billion in daily futures volume shows the market is still heavily leveraged. That combination can fuel fast moves in either direction, especially if Bitcoin price tests the $83,000 level again in the coming sessions.
For now, the $83,000 daily close remains the level most traders are watching. Until BTC closes and holds above it, this rally is being treated by many chart watchers as a retracement inside a larger downtrend rather than a confirmed reversal.
Disclaimer
This article is for informational purposes only and does not constitute financial, investment, or trading advice. Readers should conduct their own research and consult a licensed financial advisor before making any investment decisions. The publisher holds no responsibility for financial losses incurred from decisions based on this content.

















