Bitcoin Price May Gain If the AI Bubble Bursts, Arthur Hayes Says


Bitcoin is sitting at a make-or-break point this week. The coin is trading close to $64,150, right at the edge of a technical pattern that traders have been watching for days.
A break above one key price could open the door to a bigger move. A failure to break out could send Bitcoin back down toward its recent lows.
At the same time, a well-known crypto voice is making a case for why Bitcoin could win big if trouble hits the AI industry.
What is Bitcoin's price today?
BTC was last seen trading around $64,149, up slightly on the day. The coin has been stuck in a narrow range for the past week, moving between roughly $62,200 and $65,000.
Trading volume has slipped. Spot volume over the past 24 hours came in near $3 billion, while futures volume sits around $48 billion. Open interest, which tracks the total value of unclosed futures contracts, is just under $48.8 billion.
Bitcoin's market cap stands at roughly $1.28 trillion. Circulating supply is at 20.06 million BTC, out of a max supply capped at 21 million, meaning most of Bitcoin's total supply has already been mined.
Why is $64,300 the key level for Bitcoin?
Chart watchers are focused on one number: $64,300. According to analysis shared by Ali Charts, BTC is testing the upper edge of a descending channel, a pattern where price has been making lower highs and lower lows over time.
A four-hour candle that closes above $64,300 would count as a breakout signal. That kind of move could open the path toward $65,500, and possibly $66,500 if buying pressure builds.
Until that close happens, though, the pattern remains bearish on paper. Traders often wait for confirmation rather than acting on a single touch of resistance.
Level | Price | What It Means |
Resistance (breakout trigger) | $64,300 | 4H close needed to confirm breakout |
First upside target | $65,500 | Near-term target if breakout holds |
Second upside target | $66,500 | Extended target on strong momentum |
Current price | ~$64,150 | Just below the key resistance zone |
Is Bitcoin network activity rising?
Away from the price charts, the Bitcoin network itself is showing more life. Weekly active addresses have jumped 20%, crossing above 720,000, according to data shared by Ali Charts and sourced from Santiment.
More active addresses generally point to more people moving coins around, whether for trading, spending, or transferring between wallets. It does not guarantee higher prices on its own, but it does show the network is seeing more use than it was just a week or two ago.
What do rising exchange reserves mean for Bitcoin?
Not every signal is pointing the same direction. Over 20,000 BTC has flowed onto exchanges recently, based on CryptoQuant data cited by Ali Charts. Exchange reserves have climbed from around 2.70 million BTC in late July to roughly 2.72 million now.
When coins move onto exchanges, it can mean holders are getting ready to sell. It is one of the more closely watched sell-side signals in crypto trading, though it does not always lead to an immediate price drop.
This trend sits in contrast with the ETF story. On a recent day, BTC ETFs pulled in $211.49 million in net inflows, a sign that institutional demand has not slowed down even as some coins move toward exchanges.
Could an AI bubble actually help Bitcoin?
BitMEX co-founder Arthur Hayes published a new essay called "Situationship," and it is getting attention across the crypto industry. His argument centers on how the AI investment boom looks less like a normal tech cycle and more like a real estate buildout.
Hayes has pointed to the scale of spending on data centers and related infrastructure. He suggested that if this spending turns into a bubble, the resulting downturn could look more like the 2008 credit crisis than the dot-com crash of 2000.
The connection to Bitcoin comes down to central bank policy. Hayes has argued that if an AI-driven slowdown hits the economy, central banks would likely respond with monetary easing and added liquidity.
That kind of environment, in his view, would end up fueling a new bull run for Bitcoin and the wider crypto market.
It is worth noting this is one analyst's opinion, not a guaranteed outcome. Markets rarely move in a straight line, and an AI slowdown could just as easily bring short-term risk-off selling that hits Bitcoin before any easing kicks in.
What is Bitcoin's Long/Short ratio right now?
Derivatives data shows a market that is leaning bullish but not overly stretched. The 24-hour Long/Short ratio sits at 1.03, meaning long positions slightly outnumber short positions.
On Binance, the BTC/USDT Long/Short account ratio is higher, near 1.27, and top traders on the platform show an even stronger long bias at 1.52 by position size.
On OKX, the BTC Long/Short account ratio sits at 1.32, pointing in the same bullish direction.
Options markets are cooling off even as futures stay active. Options volume over the past 24 hours dropped 27.23% to $2.60 billion, while options open interest edged up 1.73% to $26.63 billion.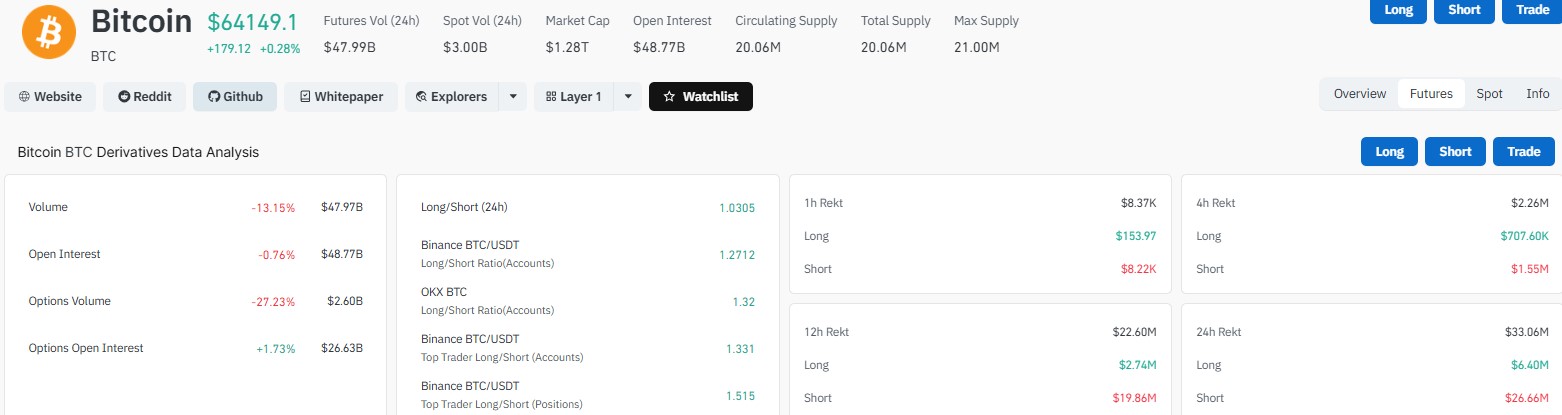
How much has been liquidated in Bitcoin trading?
Liquidation data shows shorts have been under the most pressure across every timeframe measured.
Timeframe | Total Liquidated | Long Liquidations | Short Liquidations |
1 hour | $8.37K | $153.97 | $8.22K |
4 hours | $2.26M | $707.60K | $1.55M |
12 hours | $22.60M | $2.74M | $19.86M |
24 hours | $33.06M | $6.40M | $26.66M |
Across all four windows, short positions account for the bulk of liquidations. That pattern suggests traders betting on a price drop have been getting squeezed as Bitcoin holds firm near resistance.
Bottom line for Bitcoin traders
Bitcoin is at a genuine decision point. A confirmed four-hour close above $64,300 would give bulls a clear signal, with $65,500 and $66,500 as the next stops.
Rising network activity and steady ETF inflows support the bullish case. Growing exchange reserves and a market still sitting below its recent highs offer reason for caution.
The Arthur Hayes essay adds a longer-term angle worth watching, even if it does not change what happens on the four-hour chart this week.
Disclaimer
This article is for informational purposes only and should not be considered financial or investment advice. Past performance is not indicative of future results. Always conduct your own research and consult a licensed financial advisor before making any investment decisions.


















