Hyperliquid Price Prediction: Can HYPE Rally to $63?


Hyperliquid price prediction searches are picking up after HYPE pulled off a move that caught a lot of traders' attention.
The coin cleared a multi-day descending trendline and kept climbing, pushing roughly 7% above the point where that breakout happened.
It is now sitting right above a resistance zone it has not fully cleared on a closing basis. That tension is exactly what this setup is built around.
Technical analysis prepared by CoinGabbar's crypto research desk. This piece is for informational purposes only and is not financial advice. CoinGabbar and the analyst do not hold a position in HYPE at the time of publication.
The levels described here apply strictly to the 1-hour timeframe covered and should be rechecked if the price closes beyond the stated range.
HYPE Trend and Momentum: Key Takeaways
Price broke its descending trendline and has extended roughly 7% above that breakout point
Price is holding above the $55.680 to $55.878 resistance zone but has not confirmed a strong continuation yet
A sustained close above $56.612 opens to $60.429, then $63.450.
A close below $52.820 instead shifts focus to $51.135 support
Shorts dominated liquidations across every window over the past 24 hours
Hyperliquid Price Right Now
Metric | Value |
Price | $56.001 |
24h Change | +3.43% |
Market Cap | $14.11B |
Futures Volume (24h) | $1.75B |
Spot Volume (24h) | $104.83M |
Open Interest | $2.35B |
Circulating Supply | 252.38M |
Total Supply | 952.82M |
Max Supply | 952.82M |
Open interest is the total value of Hyperliquid derivative contracts still open across exchanges, a rough gauge of active leveraged positioning.
Chart source: HYPE/USDT 1-hour perpetual contract, TradingView, Binance data feed, captured August 5, 09:31 AM IST (04:01 AM UTC).
Market cap, volume, and supply data from Hyperliquid market data on CoinGlass were captured the same day.
Hyperliquid Price Prediction Methodology and Data Sources
This read uses the HYPE 1-hour chart for structure, with volume, open interest, and market cap figures from CoinGlass, and liquidation flow from the Hyperliquid liquidation tracker.
Levels are only treated as invalidated on a confirmed closing candle beyond the stated trigger, not an intraday wick. For a wider look at where this move could be heading next, see whether price is gearing up for its next big move.
Hyperion Wallets Unstake $28.56M in $HYPE
A fresh on-chain flag adds another layer to this outlook.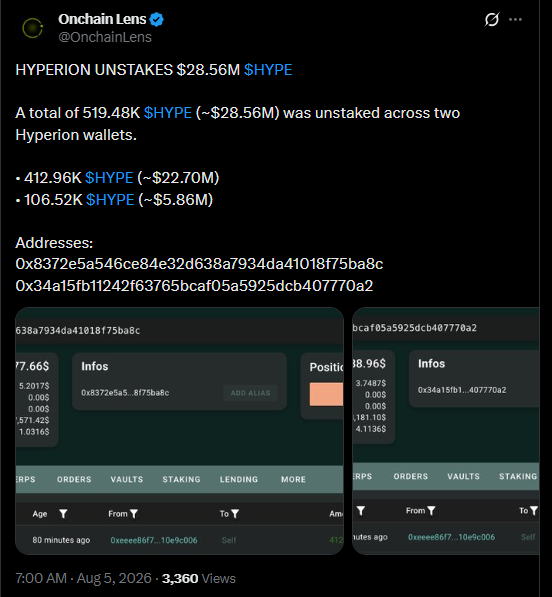
Onchain Lens reported that a total of 519.48K HYPE, worth close to $28.56M, was unstaked across two wallets tied to Hyperion.
The breakdown showed 412.96K $HYPE, around $22.70M, moved from one wallet, while a second wallet released 106.52K HYPE, close to $5.86M.
Large unstaking events like this do not always translate into selling pressure, but they do put more liquid supply back into circulation, a dynamic worth watching alongside the critical support levels $HYPE would need to defend if sentiment turns.
Source: Onchain Lens, X, posted 7:00 AM, August 5.
HYPE Spot ETF Update
ETF flows offer a useful secondary read on sentiment.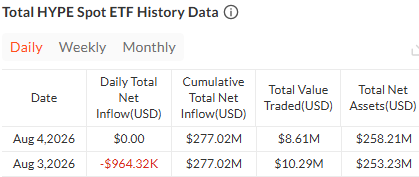
On August 4, the Hyperliquid spot ETF logged zero net daily inflow, leaving cumulative net inflow unchanged at $277.02M, while total value traded came in at $8.61M and total net assets stood at $258.21M.
The prior day, August 3, saw a net outflow of $964.32K, with $10.29M in value traded and total net assets of $253.23M.
The flat-to-slightly-negative flow trend suggests institutional appetite has cooled off a touch even as the spot price pushed higher, a divergence worth watching alongside the broader Hyperliquid price outlook for August.
Source: HYPE spot ETF data, SoSoValue, checked August 5, around 9:31 AM IST.
Hyperliquid Liquidation Snapshot
Liquidations lean heavily toward shorts across every timeframe. The 1-hour window shows $10.90K wiped out, $2.01K from longs against $8.90K from shorts.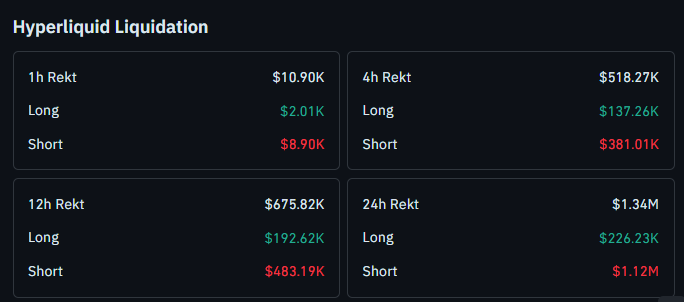
The 4-hour window shows $518.27K total, with $381.01K from shorts against $137.26K from longs. The 12-hour window shows $675.82K total, with $483.19K from shorts versus $192.62K from longs.
Across the full 24 hours, liquidations hit $1.34M, with shorts accounting for $1.12M of that and longs making up $226.23K.
That kind of one-sided short unwind often shows up right around a level like this one, a question also explored in whether HYPE's breakout zone can hold on the next test.
Source: HYPE liquidation data, CoinGlass, checked August 5, around 9:31 AM IST.
Is HYPE's Breakout Ready to Extend or Starting to Fade?
Is this breakout built to run, or is it already running out of steam? Right now it still looks intact, but the signals are mixed.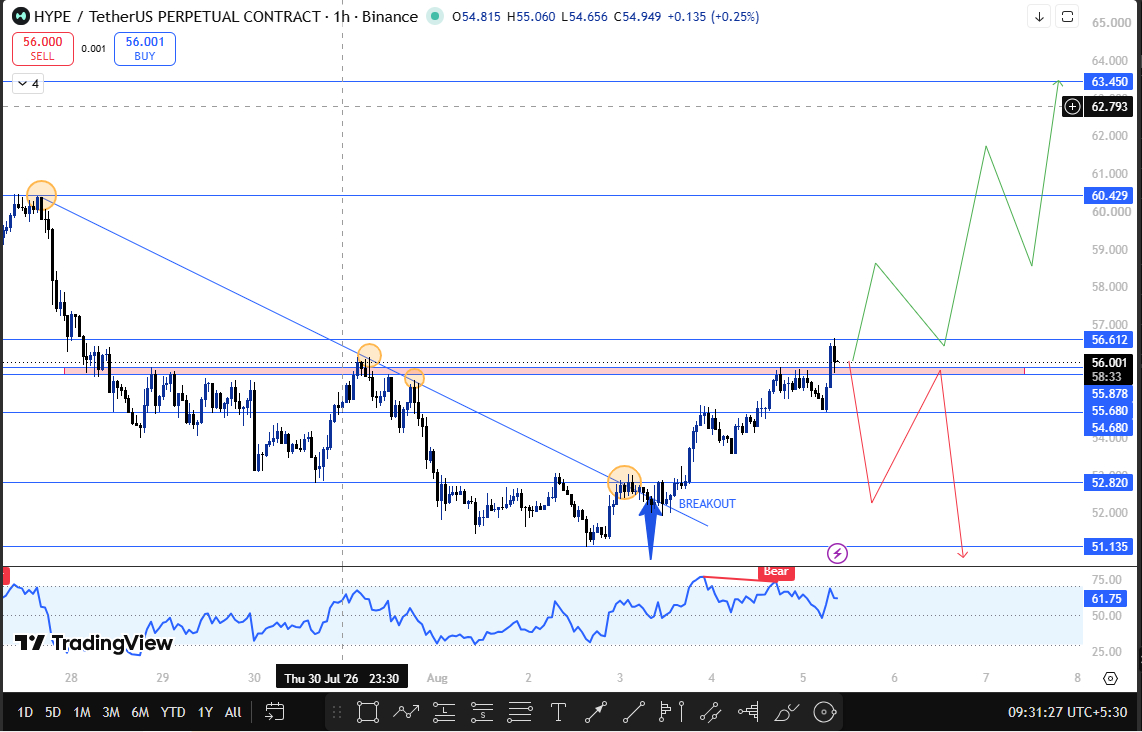
Price cleared a multi-day descending trendline on the 1-hour chart with a strong breakout candle, and price has since pushed roughly 7% above where that trendline gave way.
Instead of fading back into the old range, HYPE has held above the prior swing highs, effectively turning them into a fresh support shelf, a setup also explored in whether HYPE is gearing up for a genuine bullish setup.
HYPE is now trading through a tight zone between $55.680 and $55.878, the same area that capped price on the way up and is now being tested as support, a dynamic broken down further in what shapes HYPE's current decision range.
If price sustains above that zone with a confirmed close, the next resistance sits at $56.612, followed by $60.429, and then an extended target of $63.450.
If instead the price breaks and closes below $52.820, the next support comes in at $51.135.
The chart's momentum oscillator RSI is showing a bearish divergence; the price is printing higher highs while the oscillator itself is printing lower highs, which suggests the momentum behind each fresh push is fading even though price keeps climbing.
It does not guarantee a reversal, but it is often an early warning that buying pressure could be running thin.
HYPE Trend Prediction: Technical Outlook Snapshot
Indicator | Signal |
Trend | The descending trendline broke, and the price extended roughly 7% above the breakout point. |
Structure | Trading through the $55.680 to $55.878 zone, no strong continuation confirmed yet |
Momentum Oscillator RSI | Showing a bearish divergence against the recent price highs |
Liquidations | Shorts dominated every window over the past 24 hours. |
HYPE Support and Resistance Levels to Watch
Type | Level | Note | % From CMP |
Extended Target | $63.450 | Reachable only after clearing $60.429 | +13.30% |
Resistance 2 | $60.429 | Second target on continuation | +7.91% |
Trigger Resistance | $56.612 | Confirms continuation on a closing basis | +1.09% |
Current Zone | $55.680 to $55.878 | Former resistance, now acting as support | -0.57% to -0.22% |
Pullback Support | $54.680 | Shallow pullback zone if the current zone holds | -2.36% |
Breakdown Trigger | $52.820 | Invalidates the setup on a closing basis | -5.68% |
Support 1 | $51.135 | Next support if $52.820 fails | -8.69% |
Risk-Reward Table
Case | Trigger | Target |
Bull Case | Sustains a close above $56.612 | Move toward $60.429, then $63.450. |
Bear Case | Closes below $52.820 | Slide toward $51.135. |
What Would Change This Hyperliquid Price Prediction?
The setup stays undecided while HYPE trades inside the $52.820 to $56.612 range.
A confirmed close above $56.612 validates the breakout continuation, while a close below $52.820 would suggest the extension has run out of room and also weighed in on whether HYPE's key levels hold under renewed selling pressure.
Given how sharp the initial breakout was, false moves in either direction are a real risk here, and leveraged positions near either trigger should account for that.
How Bitcoin Sentiment Could Move HYPE Higher
This setup is built off HYPE's own chart, but Bitcoin still tends to set the tone for how far a breakout like this one can extend.
A steadier Bitcoin tape generally supports the case toward $60.429 and $63.450, while a weaker Bitcoin backdrop raises the odds HYPE stays capped below $56.612 even if the immediate move holds.
When This Hyperliquid Price Prediction Gets Revisited
This Hyperliquid price prediction will be revisited on a confirmed close above $56.612 or below $52.820, or if no clear direction is confirmed within 24 hours of publication.
HYPE Glossary:
Descending Trendline: A downward-sloping line connecting successive lower highs, used to track resistance during a downtrend.
Swing High: A recent peak in price that acts as a reference point for resistance until it is cleared.
Open Interest: The total value of derivative contracts still open and unsettled.
Liquidation: The forced closing of a leveraged position when a trader runs out of margin.
RSI Divergence: When the price and the RSI indicator move in opposite directions, it often signals weakening momentum.
Hyperliquid Price Prediction: Bull, Base, and Bear Case
Bull Case: A confirmed close above $56.612 opens $60.429, then $63.450, especially if broader sentiment and Bitcoin cooperate.
Base Case: HYPE keeps holding the $55.680 to $55.878 zone with a shallow dip toward $54.680 before attempting another leg higher.
Bear Case: A close below $52.820 shifts focus to $51.135, a scenario worth watching given the bearish RSI divergence already forming.
Disclaimer:
This Hyperliquid price prediction is based on technical chart analysis and market data available at the time of writing. Cryptocurrency markets are highly volatile, and prices can change rapidly. This content is for informational purposes only and should not be considered financial advice. CoinGabbar and the analyst do not hold a position in HYPE. Always do your own research and consult a qualified financial advisor before making any investment decisions.


















