Bitcoin Network Activity Drops 40%. Is a Crash to $50K the Next Move?


Bitcoin active addresses fell 40% in two weeks. Analysts warn BTC could drop to $50,000 before the next accumulation cycle begins. Here is what the data shows.
Bitcoin's network has gone quiet over the past two weeks. The number of active addresses on the blockchain dropped from 821,000 to 494,000, which is a fall of nearly 40% in just 14 days.
That is one of the sharpest drops in on-chain participation seen during a price consolidation period this cycle.
For most people, that sounds like bad news. Fewer wallets are moving coins. Fewer transactions are happening.
But what this data actually shows is more nuanced than a surface-level read suggests.
What Does a Drop in Bitcoin Active Addresses Actually Mean?
When the Bitcoin price stops moving for a few weeks, short-term traders lose interest and move on. They are not patient people.
They came in chasing price action, and when the price goes sideways, they go elsewhere. That is exactly what the address data is showing right now.
What gets left behind is a different kind of holder. Long-term investors, institutional desks, and miners are still active, but they do not generate the same daily address volume that retail speculation does.
So the count falls. The network looks quiet. But the composition of who is holding shifts in a healthier direction.
This same pattern appeared before the 2020 breakout and before the 2022 bottom. In both cases, falling address activity during a price consolidation phase preceded a significant repricing event.
The question this time is whether that repricing goes up first or down first.
Why Did Bitcoin Get Rejected at $82,850?
The weekly price chart tells the story clearly. BTC price peaked near $126,000 in mid-2025 and has been selling off since.
During the decline, the $79,000 to $84,000 range acted as support multiple times. That level has since broken and flipped into resistance.
In early May 2026, Bitcoin tried to climb back above that zone. It tested $82,850, touched the underside of the old support level, and was turned away.
That kind of rejection, where a broken support level becomes a ceiling on the next rally attempt, is one of the most reliable signals in technical analysis. It tells you that sellers are still in control at that price.
"The $82,850 resistance rejection is now confirmed. BTC is set to dump toward the $50,000 zone in the next few days."
Merlijn The Trader, via X
The chart shared by @TedPillows on X shows three separate rounded top formations, each lower than the one before it.
One near $104,000 in early 2025, one near $126,000 in mid-2025, and a smaller double-top near $98,000 in early 2026.
Three lower highs with one key support zone now lost. That is a textbook setup pointing toward further downside before any sustainable recovery.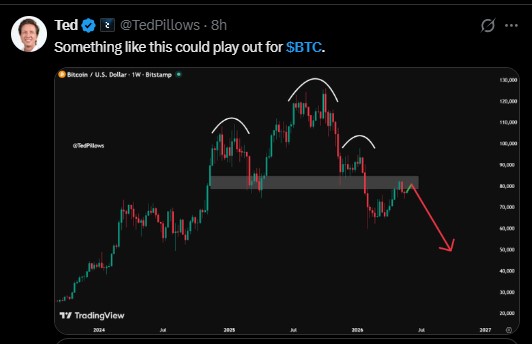
Where Could Bitcoin Actually Bottom in 2026?
The $50,000 to $55,000 range is not a random target. It sits near the 2021 all-time high of $69,000 adjusted for the structural levels that held as support during the 2022 bear market.
In Bitcoin price history, the previous cycle's all-time high tends to act as a strong support zone in the next cycle's correction. The $54,000 level fits that framework well.
Kalshi, a regulated prediction market platform, currently has traders pricing in a $54,000 Bitcoin as a realistic scenario for 2026. These are real money positions, not social media guesses.
That level lines up with the $40,000 to $55,000 accumulation zone that long-term cycle analysts have been pointing to as the ideal buy range for this phase of the market.
Is the Bitcoin Cycle Broken or Just Taking Longer?
The most important question right now is whether the broader Bitcoin bull cycle is still intact. Based on the data, the answer appears to be yes, just slower than previous cycles.
The 2022 cycle bottomed between $15,000 and $25,000 and rallied all the way to $126,000, a roughly five to eight times return. The current cycle, by the same framework, is building its base between $40,000 and $55,000.
From that zone, analysts like Merlijn project a next target above $140,000, which would be roughly a three times return from the accumulation zone.
The multiple is smaller because Bitcoin is a bigger, more mature asset now. But the structure of the cycle is repeating.
The cycle is not broken. It is slower. A drop to $50,000 from current levels near $82,000 would be painful in the short term, but it would set up the same kind of opportunity that the $15,000 to $25,000 range offered back in 2022 to 2023. People who bought there made five times their money by late 2025.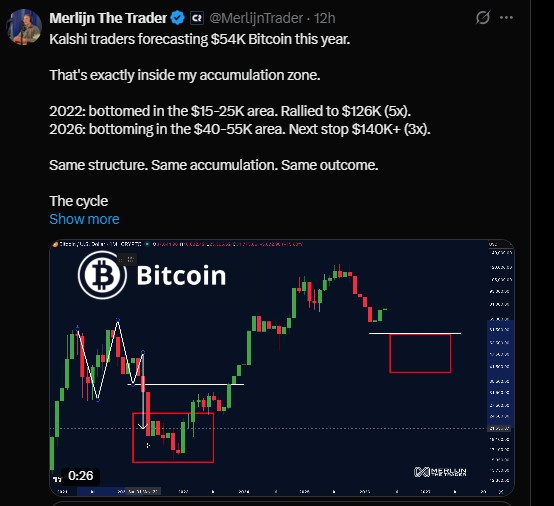
What Should You Watch Over the Next Two Weeks?
The most important level to track is $82,850 on a weekly close. If Bitcoin can reclaim that price with strong volume, the bearish rejection thesis weakens significantly.
If it stays below and breaks under $76,500, the next support zones come in around $65,000 first and then $54,000 as the deeper target.
On the on-chain side, watch whether active addresses stabilize around the current 494,000 level or continue sliding lower.
A floor in address activity alongside steady or rising prices would be an early signal that accumulation is starting.
A continued fall in both price and address count together would suggest the selling pressure has not exhausted itself yet.
The data right now points toward more downside before a recovery. But if the cycle framework holds, the $40,000 to $55,000 zone will turn out to be one of the better buying opportunities of this decade, just as the 2022 low did for those patient enough to hold through it.
Disclaimer: This article is for informational purposes only and does not constitute financial or investment advice. Cryptocurrency markets are highly volatile. Past cycle patterns do not guarantee future results. Always conduct your own research before making any investment decisions.
Also read:

















