Bitcoin Price Prediction June 2026: Where Is BTC Price Headed?


Bitcoin has spent the better part of this week grinding inside a tight range, and the chart is not giving much away. Sellers have not broken the structure. Buyers have not taken control either.
For traders and investors tracking the Bitcoin Price Prediction June 2026, that kind of standoff does not last long, and the resolution matters more than most moves this year.
Bitcoin Price on May 25, 2026: $76,135 With 24-Hour Volume at $21B
BTC is changing hands near $76,135 today. Volume over the last 24 hours is around $21 billion, and the total market cap sits close to $1.54 trillion.
The Fear and Greed Index is at 30. That reading sits right at the border of Fear, which carries a specific implication — most retail traders have already pulled back from the market.
When that group steps aside, dips tend to get absorbed by larger participants who are less reactive to short-term noise.
The $75,000 to $77,000 range has been tested from both sides multiple times this week. Buyers defend the lower end. Sellers cap the upper end.
A break from this range is coming, and the direction of that break sets the tone for the Bitcoin Price Prediction June 2026 going forward.
Why $77,500 to $78,000 Is the Level That Actually Matters for BTC
Before anyone starts talking about $80,000, Bitcoin has to deal with $77,500 to $78,000 first. That zone was supported for weeks before it broke. Now it is resistance, and resistance that was previously supported tends to be sticky.
A daily close above $78,000 changes the picture significantly for any Bitcoin Price Prediction June 2026 analysis. That would signal that buyers absorbed the supply sitting in that range and pushed through it — not just an intraday spike, but an actual session close.
Without that, any push toward $80,000 is vulnerable to rejection.
Analyst Ted Pillows pointed out that BTC already secured a daily close above $75,000, which is a base-level positive. But the real test is $78,000.
A failure there, followed by a close back under $75,000, puts the $75,000 zone at risk of a more serious breakdown.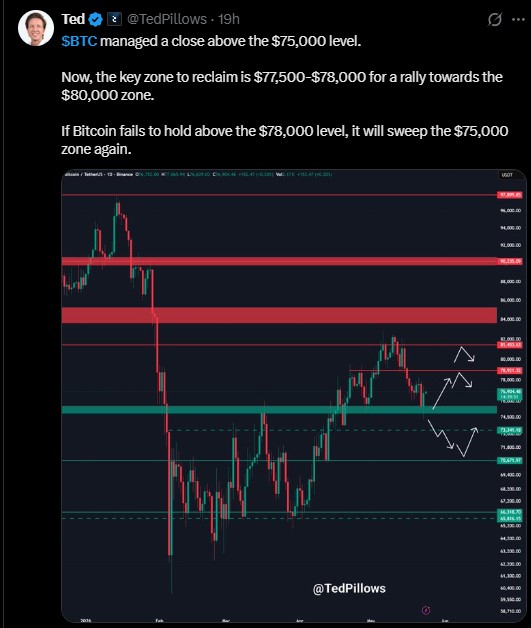
Bitcoin Ichimoku Cloud Setup: Bearish Cross but Cloud Support Held
Two things are happening on the Ichimoku chart simultaneously, and they pull in opposite directions — both of which carry weight for the Bitcoin Price Prediction June 2026 outlook.
The Tenkan crossed below the Kijun. That is a bearish signal on the daily timeframe. It means short-term momentum has rolled over, and the near-term bias has shifted to sellers.
At the same time, Bitcoin found a floor right at the Kumo Cloud. The cloud is not a thin line — it is a zone, and price bouncing from its lower boundary is exactly the kind of reaction Ichimoku traders watch for. That bounce shows longer-term demand is still present.
The condition for a bullish shift is clear: Bitcoin needs daily closes back above both the Tenkan and Kijun. Until that prints, the chart structure is neutral at best. Trying to call a trend reversal before those closes happen is jumping ahead of the data.
Rising Channel Lower Band Near $76,000: Structure Still Intact
Pull back to the broader daily view, and Bitcoin is still inside a rising channel that dates back several months. The lower boundary of that channel runs between $76,000 and $77,000 — right where the price is sitting today.
The 20-day EMA is clustered in the same area, stacking another layer of support on top. RSI near 48 reflects what the price is already showing: no dominant side, no conviction either way.
If bulls defend this channel base and price pushes back above $80,000 with meaningful volume, the Bitcoin Price Prediction June 2026 upside scenario targets the $88,000 to $92,000 resistance zone next.
A full channel extension on the higher end puts $100,000 to $108,000 in scope. A weekly close below $76,000 with follow-through shifts the downside targets to $72,000 and $68,000, respectively.
Bear Flag Since February and the CME Gap: Downside Risk Is Real
There is a bear flag on the chart that has been building since February 2026. The structure is textbook — sharp drop, slow grind higher on declining momentum, and a narrowing range before the potential breakdown.This pattern is one of the key risks to any bullish Bitcoin Price Prediction June 2026 thesis.
One analyst flagged that the CME futures gap between $80,000 and $84,000 may have already been filled during the recent bounce. CME gaps draw price until they close.
Once closed, that magnetic pull is gone, and the market loses one of its cleaner upside excuses.
If the bear flag resolves to the downside, the measured target lands near $62,000 by the end of June.
That is the extreme scenario, not the base case — but the chart pattern behind it is valid, and traders with long exposure should have it on their radar.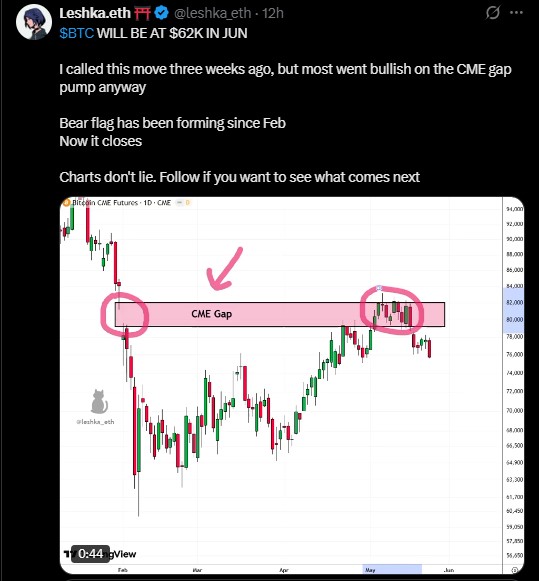
Fed Meeting June 17, 2026: What It Means for Bitcoin Price
The Federal Reserve meets on June 17. Fed futures are pricing a 98.1% probability of a hold at 350 to 375 basis points. Only 1.9% of the market is pricing any hike.
For Bitcoin, a confirmed hold on June 17 clears one of the bigger macro question marks sitting over the market. Rate uncertainty suppresses institutional risk appetite.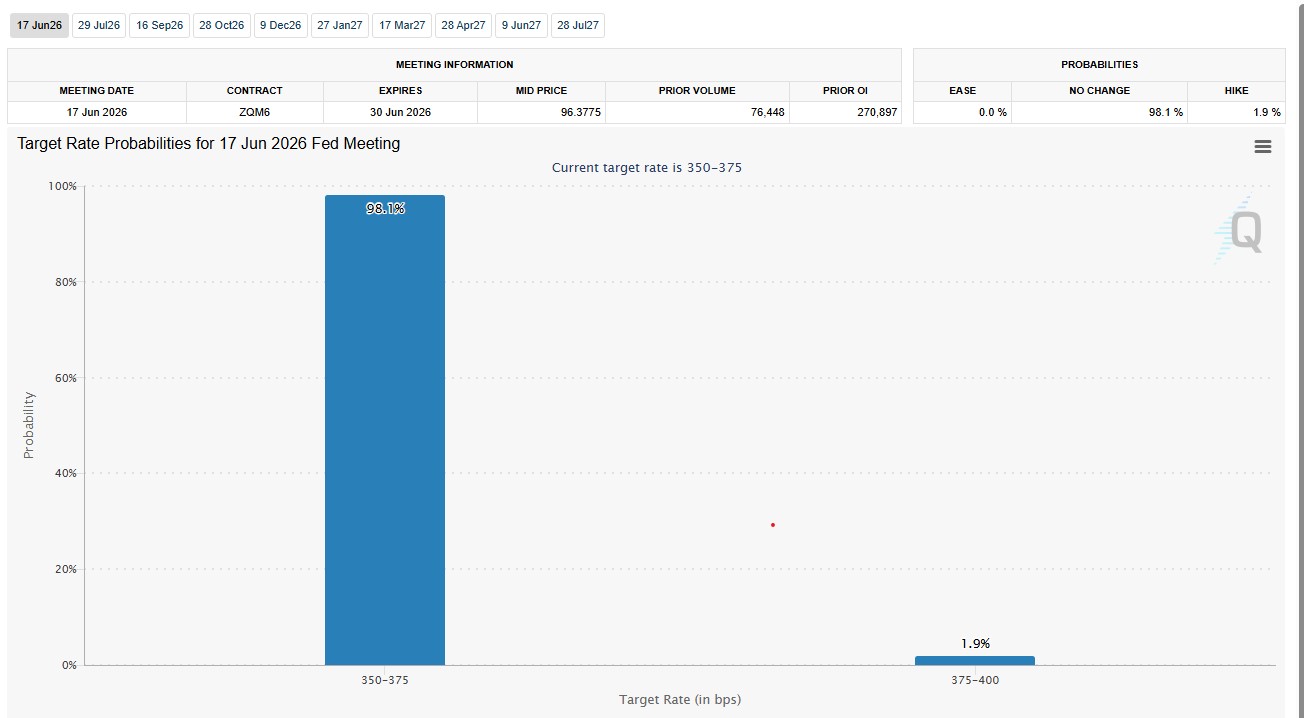
When that uncertainty resolves — especially in the direction of no change — capital tends to move back toward risk assets. Bitcoin has historically been sensitive to that shift.
The CLARITY Act, passed recently in the United States, also improved the regulatory backdrop for crypto.
Combined with a stable rate environment, these two factors give institutional buyers more reason to add exposure at current levels than they had at any point in 2025.
Bitcoin Price Prediction June 2026: Bullish, Base, and Bearish Cases
Bullish case: Bitcoin holds above $76,000, reclaims $78,000 on a daily close, and breaks $80,000 on volume. The path toward $88,000 to $92,000 opens. The June 17 Fed hold adds fuel.
Base case: BTC chops between $74,000 and $80,000 through early June. The Fed meeting on June 17 forces a directional decision. This scenario fits the current structure best.
Bearish case: A daily close under $75,000 opens $72,000. Accelerated selling from their targets, the bear flag level is near $62,000 as the worst-case outcome.
The structure still gives bulls a marginal edge at current levels. That edge disappears if $75,000 goes on a closing basis. The $77,500 to $78,000 reclaim remains the single most important price event to watch in the days ahead.
For a longer-term view on where BTC is headed, the full Bitcoin price prediction breaks down monthly and yearly targets based on on-chain data, historical cycles, and technical structure.
This article is for informational purposes only and does not constitute financial or investment advice. Always conduct your own research before making any investment decision in cryptocurrency markets.
Also read:












.webp)




