Bitcoin News Today: 5 Events That Could Send BTC to $100K or $50K


Bitcoin price today sits near $79,000, caught between bullish on-chain signals and a heavy macro calendar. Traders are watching five major events in the next ten days that could decide where BTC price heads next.
This Bitcoin price prediction breaks down the charts, the Fed setup, and what analysts expect.
What Is Bitcoin's Price Today?
BTC is trading around $79,129, up 0.57% on the day, according to derivatives data. Futures volume over 24 hours sits near $55.65 billion, with open interest around $53.85 billion.
The long/short ratio is close to even at 0.9778, with Binance and OKX showing slightly higher long positioning.
In the past 24 hours, total liquidations across the market came in around $77.51 million, split between $57.52 million in long liquidations and $19.99 million in short liquidations. That gap shows long positions are currently under more pressure than shorts.
Separately, CoinGlass data puts the broader 24-hour figure at $251.69 million across more than 82,000 traders, with the single largest order a $2.96 million long liquidation on Binance BTC/USDT.
Why Is Bitcoin Price Moving This Week?
Five catalysts are lined up back-to-back, and each one carries weight for bitcoin price today and beyond.
September 10 – PPI: A hot producer price reading could push the Fed toward a more hawkish tone.
September 11 – CPI: July's print was 3.4%. A hot number here would strengthen the case for a rate move.
September 15 – Clarity Act vote: The Senate holds a procedural vote on the crypto market structure bill.
September 16 – Fed rate decision: Markets currently price a 60.4% chance the target rate rises to the 375–400 basis point range, up from 39.6% odds of staying at 350–375 bp. A week earlier, the split was 63.2% versus 36.8% in favor of the higher range.
September 18 – Bank of Japan decision: A hawkish BOJ could hit USD/JPY and ripple into risk assets, including bitcoin.
Is Bitcoin Forming a Golden Cross?
Yes, and history gives bulls a reason to pay attention. The last time BTC flashed a Golden Cross, the bear market ended, and bitcoin price surged more than 500%.
Spot demand, however, is softer this time around. Analysts say a weekly close above $83,000 could open the door to $100,000 before year-end.
Is Bitcoin Setting Up a Bearish Pattern?
Some analysts see a textbook bearish AMD pattern (Accumulation, Manipulation, Distribution) forming again, the same structure that played out through the entire bear market.
Under this view, BTC accumulated between $58,000 and $67,000, then exploded toward $80,000, flipping sentiment bullish. That move is read as the manipulation phase, and it may not be finished.
This thesis allows for a further push to $88,000–$92,000, where bullish sentiment could turn extreme. But rather than the start of a run past $100,000, it's viewed as a final trap before distribution.
If the Clarity Act slips to 2030, the longer-term target under this scenario is a rotation back toward $50,000.
What Is the Warm Supply Realized Price Signal?
Bitcoin just reclaimed its Warm Supply Realized Price, the average cost basis of coins that last moved between one week and six months ago.
The last four major reclaims of this level were followed by rallies of 69% in January 2023, 159% in October 2023, 74% in October 2024, and 34% in April 2025. Analysts flag this as another bullish signal for BTC.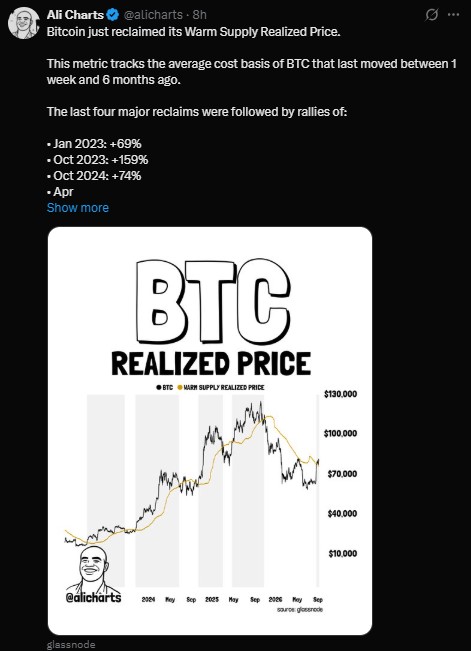
Does the MACD Confirm a Bitcoin Bottom?
On the 12-day timeframe, the current cycle shows the same 48-bar, 569-day gap between the cycle top and a bullish MACD cross as the previous cycle. The MACD histogram is turning green, and the lines are curling toward a bullish cross.
This symmetry alone doesn't guarantee a bottom is in, but combined with price holding the macro structure, some analysts see it as confirmation stacking rather than proof.
What Are the Bitcoin Price Targets?
Based on Fibonacci extensions from the current cycle structure, watched levels include:
Target | Fibonacci Level |
~$96,000 | Fib 0.702 |
~$104,000 | Fib 1.272 |
~$129,000 | Fib 1.414 |
~$175,000 | Fib 1.618 |
$215,000–$384,000 | Higher-cycle expansion |
Is Bitcoin's RSI Showing a Warning Sign?
Bearish divergence is building on BTC's chart. Price could still sweep $82,000 and print a higher high, but RSI has made lower highs at every major recent peak.
The bearish setup activates on a confirmed break below the $76,000 channel support. A push above $84,000 would weaken that thesis.
Do Bitcoin Exchange Balances Predict Price?
Not this summer, at least. As per Santiment data, Exchange balances rose about 45,000 BTC since May 11, a roughly 3% increase that is normally read as bearish.
Price did the opposite, then undid it. BTC fell from about $81,700 to $58,562 by June 30, then climbed back near $78,700, roughly where it started.
The exchange float stayed inside a narrow band of about 54,000 coins the whole time, or roughly 4% of the exchange-held total, even as price swung 40% from low to high.
This summer, exchange balance simply wasn't a reliable price predictor.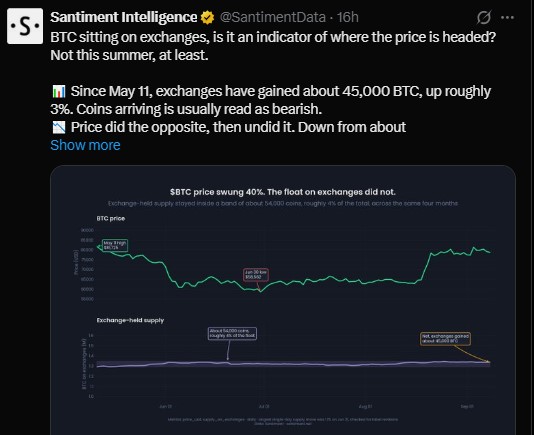
Does Bitcoin Need the Clarity Act to Rally?
Not according to BitMEX co-founder Arthur Hayes. He says the bill mainly helps projects with big legal budgets, calling it a moat-building tool that does little for real builders in US crypto.
Hayes argues bitcoin never needed the Clarity Act since its 2009 launch. What matters more, in his view, is the Treasury expanding buybacks or the Fed stepping in to help Japan swap Treasuries for cash.
He credits the recent rally to markets waking up to the US debt problem and expecting yield curve control ahead. His advice to Trump is simple: veto the bill.
What Are Bitcoin ETF Flows Today?
BTC ETFs saw $46.65 million in outflows after a three-day trading gap, breaking a streak of three straight days of inflows, according to SoSoValue data.
Bitcoin Price Forecast: Will BTC Hit $100K or Drop to $50K?
BTC price sits at a crossroads. A weekly close above $83,000 keeps the path to $100,000 alive, backed by the Golden Cross history, the Warm Supply Realized Price reclaim, and MACD cycle symmetry.
A break below $76,000, paired with a hawkish Fed and a delayed Clarity Act, would support the more cautious scenario pointing back toward the $50,000 region. The next ten days of data should offer real clarity either way.
Disclaimer
This article is for informational purposes only and does not constitute financial, investment, or trading advice. Cryptocurrency markets are highly volatile and risky. Always do your own research and consult a licensed financial advisor before making investment decisions.
Also read:


1 month ago
I invested in bitcoin trading After losing $78.4 USDT) linked to a romance fraud scam worth of cryptocurrency through an online investment platform and later discovered it was a scam. After extensive research for recovery options, I contacted CAPITAL CRYPTO RECOVER based on positive client reviews and recommendations. Their professional security team guided me through the recovery process using advanced technology, and I was able to recover my lost cryptocurrency successfully. I am truly grateful for their support and assistance during such a difficult experience. I will advise you to contact CAPITAL CRYPTO RECOVER helped me recover my funds. For anyone facing similar issues, Website: https://recovercapital.wixsite.com/capital-crypto-rec-1 Email: Capitalcryptorecover@zohomail.com Telegram: @Capitalcryptorecover Contact: Recoverycapital@fastservice.com WhatsApp/Text Number: +1 (336) 390-6684


















