GreenHood Price Prediction 2027–2030: Can HOOD Hold This Rally?


GreenHood (HOOD) just ripped over 900% in a single day, and traders everywhere are asking the same thing: is this rally real, or is it just thin liquidity doing the heavy lifting? This GreenHood price prediction breaks down the live price, RSI, MACD, key support and resistance levels, and what could realistically happen next for HOOD in the days ahead.
Quick Prediction Box
Metric | Current View |
Current Price | $0.0986 |
Trend | Bullish, but stretched |
Next Resistance | $0.15 (1.618 extension) |
Key Support | $0.076 (20 EMA) |
RSI (14) | 63.06 |
Bull Case | Break and hold above $0.10 |
Base Case | Range between $0.076 and $0.10 |
Bear Case | Slide back toward $0.05 |
Invalidation | Four-hour trading below $0.076 |
(Snapshot: September 9, 2026, roughly 05:30 UTC. Verify with a live source before trading.)
Why Is GreenHood Price Moving Today?
HOOD trades near $0.0986, up 923.5% in 24 hours per CoinGecko. Volume sits near $412,720, thin for a move this size.
And that's the tell. A spike this large on such low volume points to liquidity, not real demand. The project's own tagline promises to hand tokens to the community, a common thread across recent crypto airdrops. Bitcoin isn't driving this one.
GreenHood Price Prediction for the Next 7 Days
The 4-hour chart shows one sharp vertical candle, then choppy consolidation under $0.10, with volume fading fast.
HOOD Support and Resistance Levels
Immediate support: the 20 EMA near $0.076. Major support: $0.05. Immediate resistance: $0.09886. Breakout level: a four-hour trade holding above $0.10.
Bullish Scenario for HOOD
A breakout needs real volume, not drift. Clearing $0.10 opens $0.15 as target one, with $0.24 as a stretch goal.
Bearish Scenario for HOOD
Rejection here opens a pullback. A break below $0.076 flips the structure bearish, with $0.05 as the target. Reclaiming $0.10 invalidates the bearish case.
GreenHood Technical Analysis
Technicals on a token this young carry less weight than on an asset with years of trading behind it.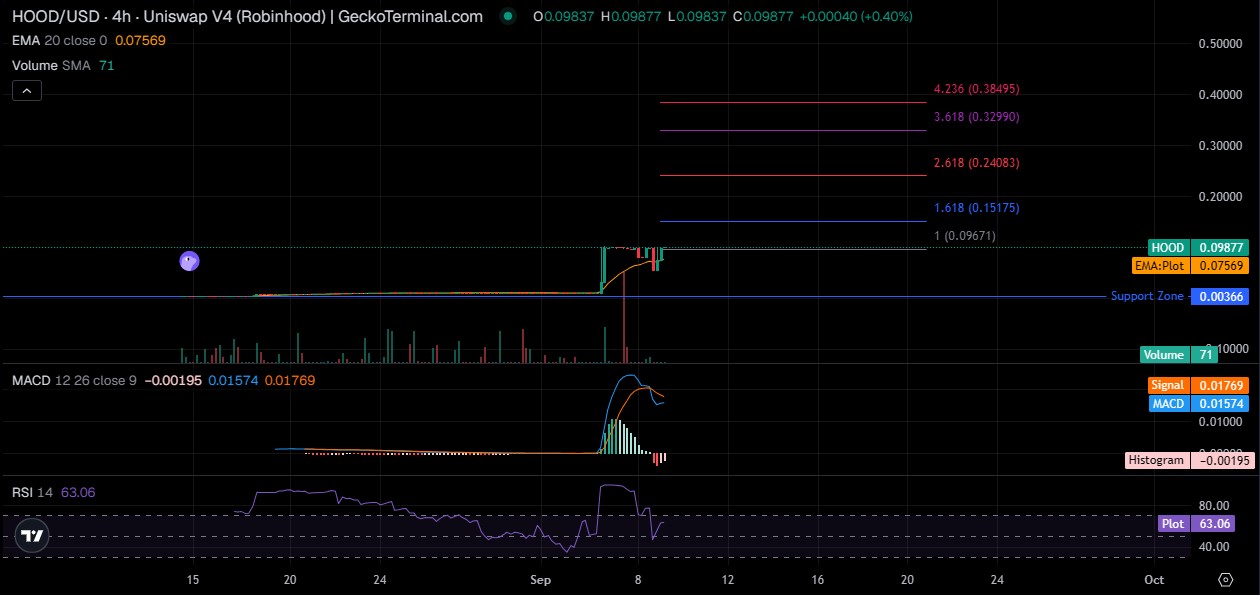
HOOD RSI and Momentum
RSI (14) reads 63.06, elevated but not overbought. When we checked the RSI history, it had already cooled off. Momentum is fading, not building.
MACD and Moving Averages
MACD sits at 0.01574 against a signal of 0.01769, with a negative histogram of -0.00195. A bearish crossover is forming, and the price sits well above the 20 EMA at $0.07569.
Volume and Breakout Confirmation
Volume spiked on the initial move, then dropped off. Turns out, that's a classic sign a breakout is running out of fuel.
Trend Structure on the 4H Chart
One dominant green candle, a red reversal right after, then a sideways chop. Indecision. Not a collapse, not yet.
GreenHood Price Prediction for 2026
Scenario | Price Range | What Needs to Happen |
Bearish | $0.03 to $0.05 | Support breaks, volume dries up |
Base | $0.05 to $0.10 | Current range holds |
Bullish | $0.15 to $0.24 | Resistance breaks on fresh volume |
These ranges come from the Fibonacci extensions already plotted on the live chart, not a formula guessing the future.
GreenHood Price Prediction 2027–2030
Nobody can hand you a guaranteed price four years out for a token that's 25 days old. What follows is a conservative, assumption-based scenario table, not a forecast, built on how meme coins typically behave once the initial hype fades.
Year | Bear Scenario | Base Scenario | Bull Scenario |
2027 | $0.005–$0.02 | $0.03–$0.07 | $0.15–$0.30 |
2028 | Below $0.01 | $0.02–$0.06 | $0.20–$0.40 |
2029 | Below $0.005 | $0.02–$0.05 | $0.25–$0.50 |
2030 | Near zero | $0.01–$0.05 | $0.30–$0.60 |
Treat every number here as conditional. None of it is a promise.
2027 assumptions: Bear case assumes fading attention with no fresh catalyst. Base case assumes a small, stable holder base survives. Bull case assumes a listing or new narrative pulls in fresh volume.
2028 assumptions: Bear case assumes concentrated top-ten wallets trigger a slow sell-off. Base case assumes the project holds its niche without much growth. Bull case assumes a broader meme-coin cycle lifts it along the way.
2029 assumptions: Bear case assumes the project goes largely dormant, common for tokens with no stated utility. The base case assumes a small community sticks around. Bull case assumes a full market cycle turn plus renewed marketing.
2030 assumptions: Bear case assumes the token is effectively abandoned. The base case assumes it survives as a minor, low-liquidity asset. Bull case assumes it becomes an established meme brand, something very few tokens manage.
Meme coins without utility carry a real chance of going to zero. And that risk doesn't shrink with time. It usually grows.
Quick Summary: 2027–2030 Outlook
Year | One-Line Outlook |
2027 | Tests whether interest holds beyond the launch pump |
2028 | Survival hinges on the holder base and any new catalyst |
2029 | Likely quiet unless a fresh narrative or cycle shows up |
2030 | Long-shot upside only if it becomes an established brand |
Track ongoing developments through the memecoin news section rather than treating any of these ranges as fixed targets.
What Could Push HOOD Price Higher?
Growth and adoption: more attention, more holders, more buyers, and the same pattern behind recent AI-token rallies.
Exchange listings: a bigger listing deepens liquidity.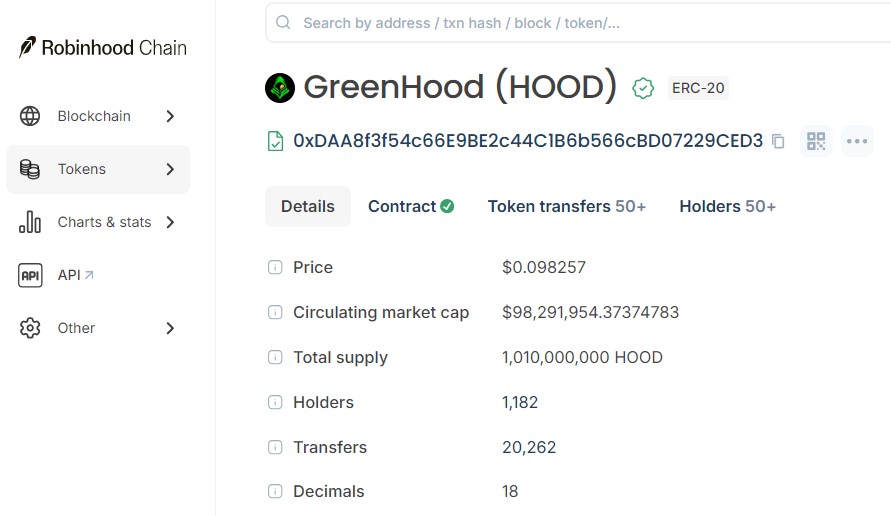
Whale activity and market trend: on-chain data shows 1,182 holders with a concentrated top ten, and a broader crypto rally lifts small meme tokens too.
What Could Send GreenHood Price Lower?
Liquidity risk: with just $14.8M in liquidity, a few large sells could hit price hard.
Failed breakout: another rejection at $0.10 weakens the setup fast.
Supply events and market weakness: watch the events calendar for unlocks, since a risk-off shift across crypto tends to hit meme coins first.
GreenHood Price Prediction: Trader Takeaway
Bullish above $0.10. Bearish below $0.076. First target near $0.15. Major resistance near $0.24. Invalidation on a four-hour close under the EMA. The price prediction hub tracks similar setups daily.
Not a coin for anyone who can't handle 20% swings before lunch. Check the live GeckoTerminal chart before acting, since numbers shift by the hour.
Disclaimer
This article is for informational purposes only and isn't financial advice. Cryptocurrency markets, especially low-cap meme tokens like GreenHood, are highly volatile and carry real risk of loss. Prices reflect a specific snapshot in time and may have changed by the time you read this. Always do your own research and consult a licensed financial advisor before investing.
Also read:

















