Bitcoin Price Prediction: BTC Holds Key Support Ahead of US CPI Data


Bitcoin is trading near $63,600 on August 12, sitting right on top of a support zone that traders are watching closely. The next few hours could decide where BTC goes next.
US inflation data, known as CPI, lands at 8:30 AM ET today. Every CPI report since October has moved BTC sharply, one way or the other. Today may not be different.
What is Bitcoin's price today?
BTC is changing hands around $63,900 to $64,000, according to data from CoinStats. In the past day, it touched a high near $64,400 and a low around $63,200.
That range has held for a few days now. Traders call this kind of tight, sideways move a "coil." It often comes before a bigger swing.
Why does the Volume POC level matter for Bitcoin?
The Volume Point of Control, or POC, marks the price where the most BTC actually traded hands. It is not a guess. It is built from real order data.
Right now, that level has flipped. What used to act as a ceiling is now acting as a floor. As long as price holds above it, buyers appear to have the edge.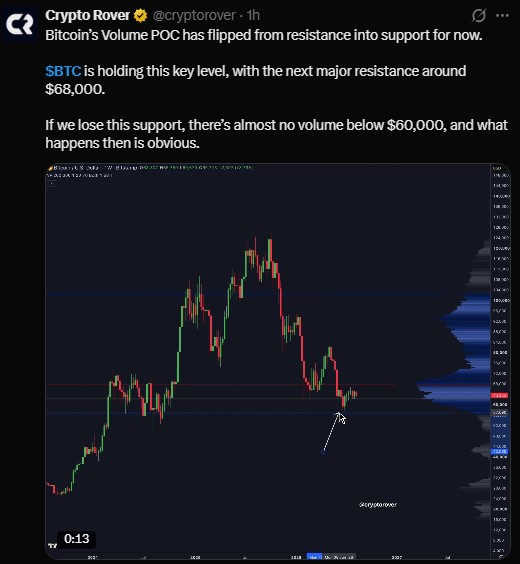
The next major resistance sits near $68,000. That is the level bulls need to clear for the next leg up.
But there is a catch. Below current support, trading volume thins out fast. Very little BTC has changed hands under $60,000 in recent months. If support breaks, price could fall quickly through that empty zone, since there are few buyers parked there to slow it down.
How will today's CPI report affect Bitcoin price?
This is the big one. US CPI data drops at 8:30 AM ET, and BTC has reacted hard to every single reading since October.
A hotter-than-expected number would hurt. It would lower the odds of a Federal Reserve rate cut, and risk assets like BTC tend to sell off when cheap money looks less likely.
A cooler-than-expected number would likely do the opposite. Rate cut hopes would grow, and the coin has historically caught a relief rally on days like that.
Neither outcome is guaranteed. But traders should expect volatility either way.
Bollinger Bands are the tightest since 2023
BTC's Bollinger Band width, a measure of how much the price is moving, has shrunk to its narrowest point since October 2023.
That matters because the last time bands got this tight, price went on a run of more than 330% over the following two years. Tight bands do not predict direction. They only suggest that a big move, in either direction, may be coming soon.
What is happening with BTC ETF flows?
Spot Bitcoin ETFs saw just $4.89 million in net inflows on August 11, according to SoSoValue. That is a small number by recent standards.
BlackRock's IBIT was the only fund with positive inflows that day. Other funds were flat or saw outflows. Weak ETF demand can be a warning sign if it continues, since institutional buying has been a key support pillar for price this year.
Metaplanet's big BTC move and losses
As per Lookonchain data, Japanese firm Metaplanet moved 3,881 BTC, worth about $247.3 million, across wallets in a three-hour window. Large transfers like this often catch traders' attention, though wallet moves alone do not always signal selling.
Metaplanet holds roughly 43,000 BTC at an average buy price of $96,191. At current prices near $63,700, that position sits at an unrealized loss of around $1.4 billion, about 34% underwater.
It is worth noting that Metaplanet has stated a long-term holding strategy, so a paper loss does not necessarily mean a sale is coming.
Does Bitcoin usually crash in August?
History is not kind to BTC in August, and midterm election years carry an extra pattern worth watching.
Year | August Decline | Context |
2014 | ~74.78% | Post-rally correction |
2018 | ~62.94% | Bear market year |
2022 | ~37.24% | Macro tightening cycle |
In midterm election years, sharp August declines have often started in the first or second week of the month. Some traders are asking if 2026 will follow the same script.
It is worth being careful here. Past patterns do not guarantee a repeat, and each of those years had different market conditions driving the drop. The 2026 pattern is still forming, and one CPI report will not confirm or deny a historical trend on its own.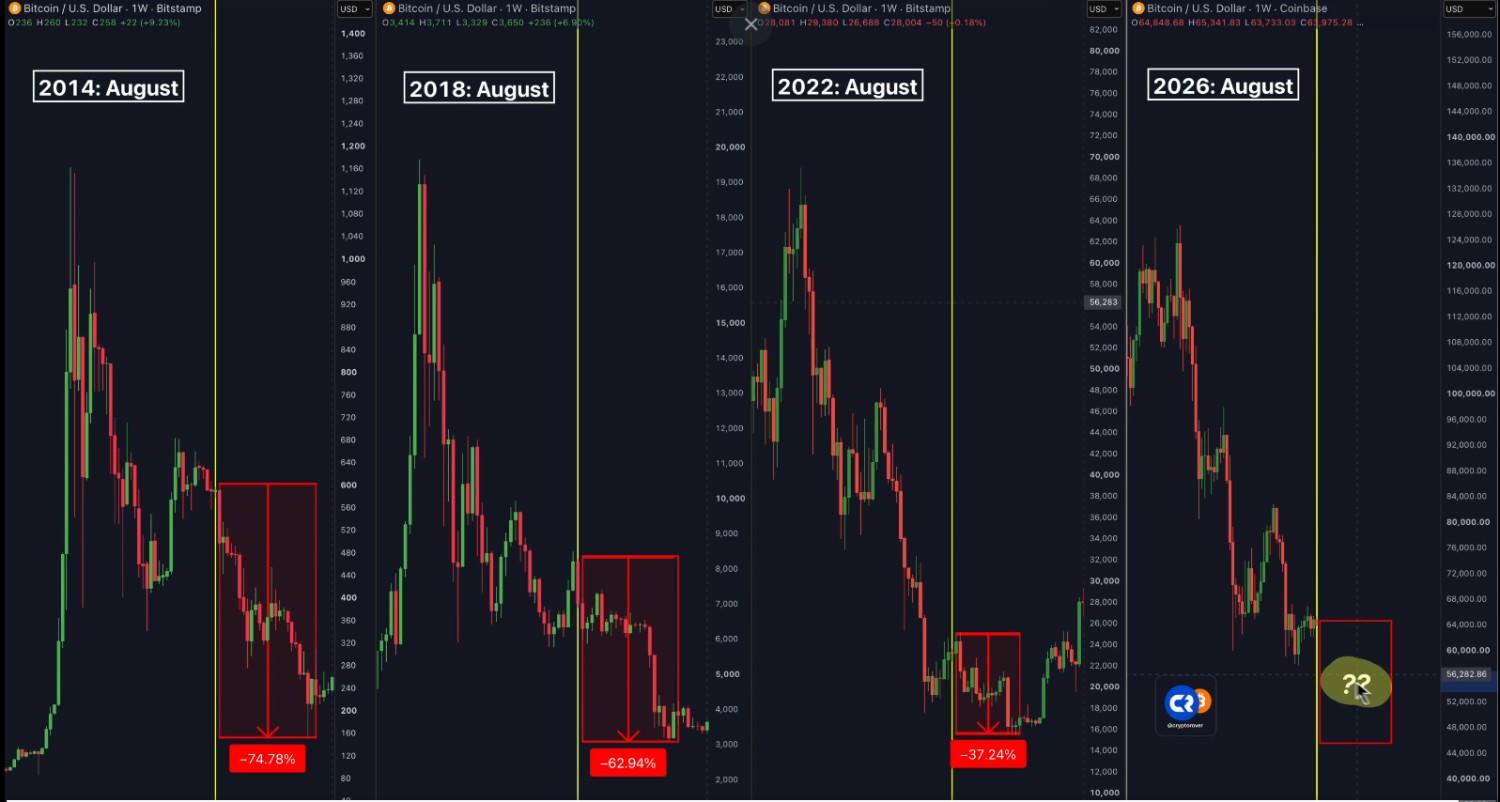
Could a capital gains tax cut change the picture?
Away from charts, there is a policy story developing. Bloomberg has reported that President Trump is weighing a cut to capital gains taxes ahead of the midterm elections.
The US has not seen a major capital gains tax cut since 2003. If this moves forward, it could have wide reaching effects on how investors treat assets like BTC, since lower taxes on gains can encourage more buying and holding.
This remains a proposal at this stage, not a passed policy, so its market impact is still speculative.
Bitcoin key levels to watch
Level Type | Price Zone | Significance |
Resistance | $68,000 | Next major hurdle for bulls |
Current Zone | $63,000-$64,400 | Volume POC support flip |
Danger Zone | Below $60,000 | Thin volume, fast moves possible |
The bottom line for BTC traders
BTC sits at a genuine crossroads today. Support is holding for now, but it is being tested at the same time as a major economic data release and a seasonal pattern that has not been kind to it in the past.
Nobody can say for certain how CPI will print, or how the market will react. What history does suggest is that today is unlikely to be a quiet one for the market.
Disclaimer
This article is for informational purposes only and does not constitute financial, investment, or trading advice. Cryptocurrency markets, including Bitcoin, are highly volatile and involve significant risk of loss. Past performance and historical patterns do not guarantee future results. Always conduct your own research and consult a licensed financial advisor before making investment decisions.
Also read:

















