Saylor Sells Bitcoin, Whales Buy: What It Means for BTC Price


Bitcoin is stuck in a tight range this week. The world's largest cryptocurrency trades near $64,000, unable to break free from a resistance wall that has capped every rally since June.
Behind the flat price chart, though, something interesting is happening. Big wallets are buying while small holders back away.
What is Bitcoin's price today?
Bitcoin changed hands around $63,965 at the time of writing, down about 1.56% over the past day. The coin touched a high near $64,110 and a low of $63,839, based on Bitstamp data.
Trading volume looks healthy. Futures volume over 24 hours came in at $45.13 billion, up over 77%. Spot volume added another $2.72 billion.
Why did crypto prices drop today?
Part of the pressure came from outside the market. Iran said it would not hold further talks with the Trump administration, choosing instead to wait until his term ends in January 2029. News like this tends to push traders toward caution, and crypto often feels it first.
BTC ETFs also saw red. After five straight days of inflows, a $144.67 million outflow hit the market yesterday, breaking that streak. That kind of reversal can weigh on short-term sentiment even if the bigger trend stays intact.
Are Bitcoin whales buying or selling right now?
This is where the story gets more interesting. According to Santiment data, the number of wallets holding at least 10,000 BTC has climbed back to a six-month high of 90 wallets.
That's a net gain of six large wallets in just eight weeks, a 7.1% rise. Meanwhile, smaller "shrimp" wallets have been losing share, partly due to recent Coldcard hardware wallet security concerns and delays around the CLARITY Act, a U.S. crypto regulation bill.
When supply moves from small hands into large ones during a quiet market, it has historically lined up with stronger price moves later on.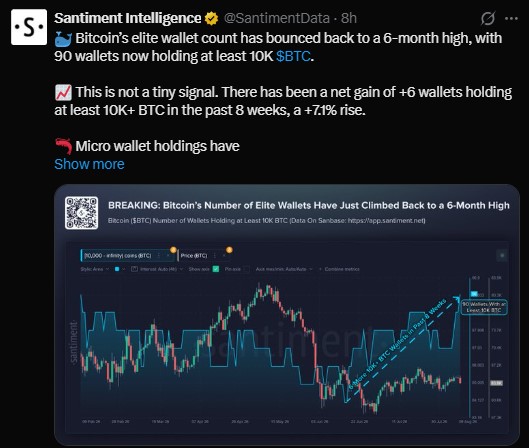
Is Michael Saylor still selling Bitcoin?
Yes, but the context matters. Strategy, the company led by Michael Saylor, sold another 1,690 BTC worth about $108.6 million last week. Over six weeks, the firm has sold 6,916 BTC, worth roughly $429.35 million.
Some hedge funds bet this selling would snowball, forcing Saylor to dump more Bitcoin to cover Strategy's 10 to 11% dividend obligations. Cathie Wood of Ark Invest pushed back on that idea. She argues Saylor is testing the market on his own terms, not being forced into a fire sale.
Saylor also confirmed Strategy increased its USD reserve by $650 million and bought back $109 million of STRC stock. As of August 9, 2026, the company holds 840,447 BTC and $4.65 billion in cash reserves.
Separately, Bitcoin miner Marathon Digital sold 23,093 BTC, worth over $1.6 billion, while still holding 35,577 BTC worth about $2.3 billion.
Bitcoin liquidations and market stress
Liquidation data from CoinGlass shows 69,266 traders were liquidated in the past 24 hours, totaling $199.73 million. That's actually on the lower end compared to the past 90 days, suggesting the market isn't under extreme stress right now.
A closer look at the breakdown shows shorts are taking the bigger hit across shorter timeframes. In the past hour, short liquidations totaled $2.37K against $4.44K in longs.
Over four hours, the gap widened, with $95.51K in short liquidations compared to $48.74K in longs. The 12-hour and 24-hour windows followed a similar pattern, with shorts losing more than longs in the 24-hour figure at $46.87M versus $2.74M.
Trader positioning also leans bullish. The Binance BTC/USDT long/short account ratio sits at 1.65, while OKX shows a similar 1.62 ratio.
Binance's top trader long/short ratio by account comes in at 1.71, and by position size at 1.56. More traders are positioned long than short right now, even with price stuck in a range.
Cathie Wood echoed a similar view on stress levels, saying she sees no major issues across private credit, banking exposure to crypto, or junk bond spreads against 10-year treasuries.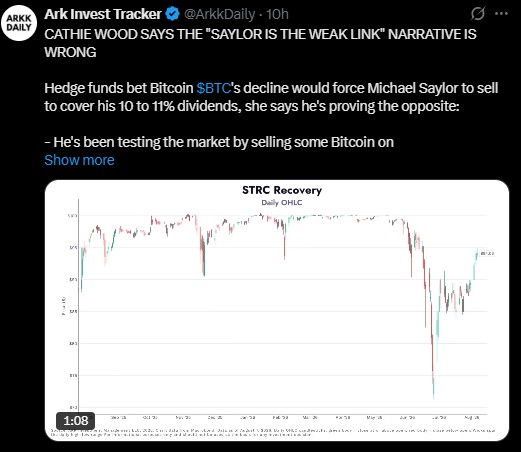
Bitcoin technical analysis: key levels to watch
Level | Price | Meaning |
Resistance | $66,700 | Break above opens path to $68K-$70K |
Resistance | $72,000 | Stronger breakout target |
Resistance | $76K-$80K | Descending trendline zone |
Support | $64,500-$66,700 | Current consolidation zone |
Support | $62,000 | Loss here turns pattern bearish |
Support | $58K-$60K | Downside target if $62K breaks |
20-week EMA | $68,495 | Bitcoin has been rejected here repeatedly this bear market |
Bitcoin looks like it's forming a compression pattern after the sharp sell-off in June. Price keeps testing the $64,500 to $66,700 zone without a clear breakout.
The RSI sits near 49, which is neutral. Neither buyers nor sellers control momentum right now.
If $BTC clears $66,700 and holds, traders may look toward $68,000, then $70,000, and eventually $72,000. A move past $72,000 could open the door to the $76,000-$80,000 zone, where a longer-term descending resistance line sits.
On the other hand, if Bitcoin fails to reclaim $66,000-$67,000 and slips under $62,000, the setup turns bearish. In that case, $60,000 and possibly $58,000-$59,000 become the next levels to watch.
What could move Bitcoin price next?
A few things stand out heading into the next few weeks:
Whether large wallets keep adding Bitcoin at the current pace
How markets react to further geopolitical headlines involving Iran and the U.S.
Whether ETF flows turn positive again after yesterday's outflow
Progress, or further delay, on the CLARITY Act
Whether Strategy's selling pattern continues or slows down
None of these guarantee a specific price outcome. Bitcoin has surprised traders in both directions before, and this range-bound stretch could resolve either way.
Disclaimer
This article is for informational purposes only and does not constitute financial, investment, or trading advice. Cryptocurrency markets are highly volatile and carry significant risk of loss. Always do your own research and consult a licensed financial advisor before making investment decisions.

















