Bitcoin Price Prediction: BTC Holds Key Level as Whale Flips Long


Bitcoin price prediction today shows BTC near a key support level as ETF outflows grow and a top whale flips long. Full technical breakdown inside.
Bitcoin is trading at a key technical area after failing to build strong momentum above $65,000. Spot ETF outflows, whale activity and thin trading volume are keeping buyers cautious.
On August 13, U.S. spot Bitcoin ETFs posted about $131 million in net outflows. ARK Invest and 21Shares' ARKB led the selling with $58.82 million in net outflows.
The pressure comes as BTC remains near the $63,000 to $65,000 zone. Recent market data puts the price around $63,600, keeping both bulls and bears close to important technical levels.
Why is Bitcoin price struggling below $65,000?
The main problem for bulls is a lack of follow-through after recent attempts to recover. A large supply area sits between roughly $62,000 and $65,000, creating a difficult zone for buyers to clear.
Short-term holders also face resistance near $68,700, according to the market data provided. A move into that area could bring fresh selling as traders look to exit positions bought at higher prices.
Trading volume has also weakened. Lower volume during a tight price range can point to consolidation, but it can also leave the market vulnerable to a sharp move when liquidity returns.
That makes $65,000 an important first test. A sustained move above $66,500 would give bulls a stronger signal, while $68,700 remains the larger resistance level.
What happens if BTC falls below $63,000?
A break below $63,000 would weaken the short-term structure and put $61,000 in focus.
The next important support zone is around $60,500 to $61,000. If that area fails, the downside could extend toward $58,500.
This is not a fixed target. It is a risk zone based on the support levels traders are watching. Market conditions, liquidity and macro news could change the setup quickly.
BTC level | Technical meaning | Market reaction to watch |
$68,700 | Major resistance | Break could improve bullish momentum |
$66,500 | Breakout trigger | Close above may attract buyers |
$65,000 | Near-term resistance | Rejection keeps pressure on BTC |
$63,000 | Key support | Loss could increase selling |
$61,000 | Major support | Buyers may try to defend the zone |
$58,500 | Deeper support | Risk rises if $61,000 fails |
Whale activity adds another layer of risk
On-chain activity is also sending mixed signals.
The large trader identified as 0x66f8 closed a 2,136 BTC short position worth about $136 million and reportedly made around $1.65 million in profit.
The trader then opened a 40x long position using 200.82 BTC, valued at about $12.74 million.
The shift from short to long is notable, but one leveraged trader should not be treated as proof of a market bottom. A 40x position also carries significant liquidation risk if price moves sharply against the trade.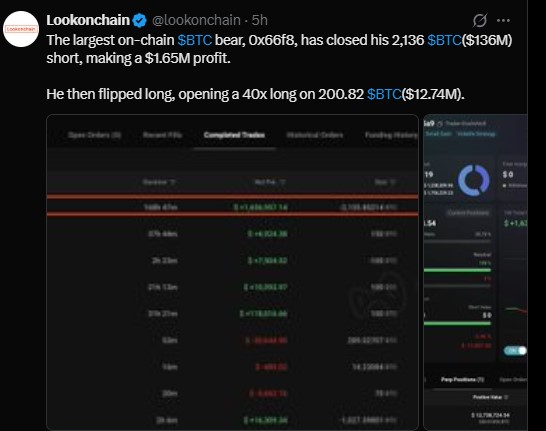
Could MSCI changes affect the Bitcoin market?
Another issue for the wider market is MSCI's review of companies whose balance sheets are heavily tied to investment assets.
The proposed methodology could affect companies such as Strategy and Metaplanet if they are judged to rely heavily on capital raising to accumulate non-operating assets.
MSCI has already said it wanted a broader review of how non-operating companies should be treated after deciding in January 2026 not to exclude digital asset treasury companies from its February index review.
The current consultation described in the supplied data could therefore become an important issue for Bitcoin treasury stocks. Any index removal could affect passive investment flows into those shares, although it would not directly change BTC's network fundamentals.
Will Strategy resume Bitcoin accumulation?
Strategy CEO Phong Le has indicated that the company expects to resume buying BTC later this year.
The supplied figures say Strategy purchased around 175,000 BTC since the start of 2026 while selling about 7,000 BTC. That would leave the company as a large net buyer despite recent sales.
Strategy has also explained that some sales were linked to preferred stock dividends, share repurchases, and maintaining U.S. dollar reserves. Earlier comments from Le similarly framed BTC sales as part of balance-sheet management rather than a change in the company's broader strategy.
Bitcoin price prediction: What are the next targets?
The short-term setup remains balanced, but the risk is asymmetric around the key levels.
A move above $66,500 would improve the chart structure and put $68,700 back in focus. A clean break above $68,700 could open the way toward higher local levels, although confirmation from volume would matter.
On the downside, losing $63,000 would make $61,000 the first major test. A break below $60,500 could expose the $58,500 area.
For now, the market is compressed between support and resistance. The next decisive move is likely to matter more than small intraday swings.
The broader picture also depends on ETF flows, institutional demand, and macroeconomic conditions. Until those signals improve together, traders may continue to treat rallies as tests rather than confirmed trend changes.
Bitcoin price outlook at a glance
Scenario | Key level | What it could signal |
Bullish | Above $66,500 | Breakout attempt strengthens |
Stronger bullish | Above $68,700 | Short-term trend could turn positive |
Neutral | $63,000-$66,500 | Range trading continues |
Bearish | Below $63,000 | $61,000 becomes vulnerable |
Deeper bearish | Below $60,500 | $58,500 becomes a possible support test |
The key question is simple: can buyers reclaim $66,500 before sellers push BTC below $63,000? Until one side wins that battle, Bitcoin remains at a crossroads.
Disclaimer: This article is for informational and educational purposes only and does not constitute financial, investment, trading, or other advice. Cryptocurrency markets are highly volatile and can result in substantial losses. Readers should conduct their own research and consider their financial situation and risk tolerance before making any investment decisions.
Also read:

















