Must watch! $PAXG Major Rally or Breakdown: PAX Gold Price Prediction


PAX Gold just printed a fresh high above $4,400 before pulling back hard, and gold-backed crypto traders are watching closely to see if this is just a breather or the start of something bigger.
This PAX Gold price prediction looks at whether PAXG can hold its recent gains, with the bullish case staying alive above $4,316.99 over the next few days, while a close below that level would put the rally on pause.
Market data was checked on August 14, 2026, at 12:00 IST.
PAX Gold Price Prediction Today: Market Overview
Metric | Value |
Price | $4,331.16 |
24h Change | -0.78% |
Market Cap | $1.89B |
FDV | $1.89B |
24h Volume | $183.9M+ |
Vol/Mkt Cap (24h) | 9.73% |
Liq/Mkt Cap | 1.02% |
Total Supply | 436.55K $PAXG |
Max Supply | ∞ (no cap) |
Circulating Supply | 436.55K $PAXG |
Holders | 86K |
Source: Data from CoinMarketCap as of August 14, 2026, at 12:00 IST. Figures may vary slightly across other tracking websites.
PAX Gold Liquidation and Volume Data
Window | Total Rekt | Long | Short |
1h | $4.97K | $4.97K | $0 |
4h | $7.81K | $6.62K | $1.19K |
12h | $56.03K | $51.92K | $4.11K |
24h | $90.66K | $68.34K | $22.32K |
Long liquidations dominate every window, which fits a market that ran up hard and is now shaking out traders who were positioned for continued upside.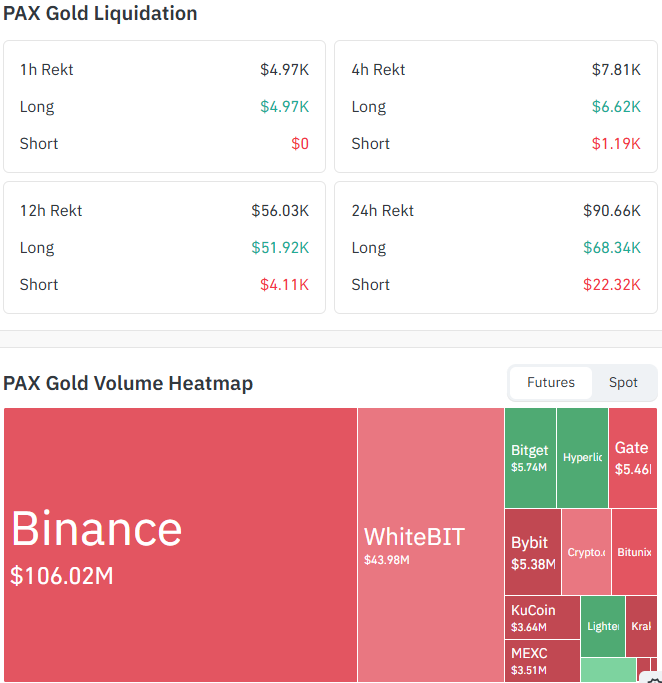
Source: Data From CoinGlass
Exchange Volume (Futures)
Exchange | Volume |
Binance | $106.02M |
WhiteBIT | $43.98M |
Bitget | $5.74M |
Bybit | $5.38M |
KuCoin | $3.64M |
MEXC | $3.51M |
Binance alone accounts for well over half of visible futures activity, with the rest spread thinly across several smaller exchanges.
Note: Futures data from Coinglass, kept separate from the spot volume figures above.
PAX Gold Price Prediction Chart: Technical Analysis
Pair: PAX Gold/USD · Market: Spot (Crypto) · Timeframe: 4H · Source: TradingView · Timestamp: August 14, 2026, 12:00 UTC+5:30
PAXG is trading at $4,331.16, after breaking Down of a rising channel and touching a high near $4,411.52 before pulling back sharply.
Price is now sitting right at a support zone where the $4,316.99 level and the EMA 50 near $4,320.63 overlap, an important area for the pullback to hold.
RSI (Relative Strength Index, a momentum reading that shows if an asset is overbought or oversold) sits at 43.19, leaning weak but not yet oversold, which fits the recent pullback from highs.
EMA (Exponential Moving Average, a trend indicator that gives more weight to recent price action) 20 sits at $4,362.26, and EMA 50 sits at $4,320.63, with price now trading below the shorter EMA and testing the longer one from above.
The short-term trend is negative until the price breaks the $4,411 resistance level. 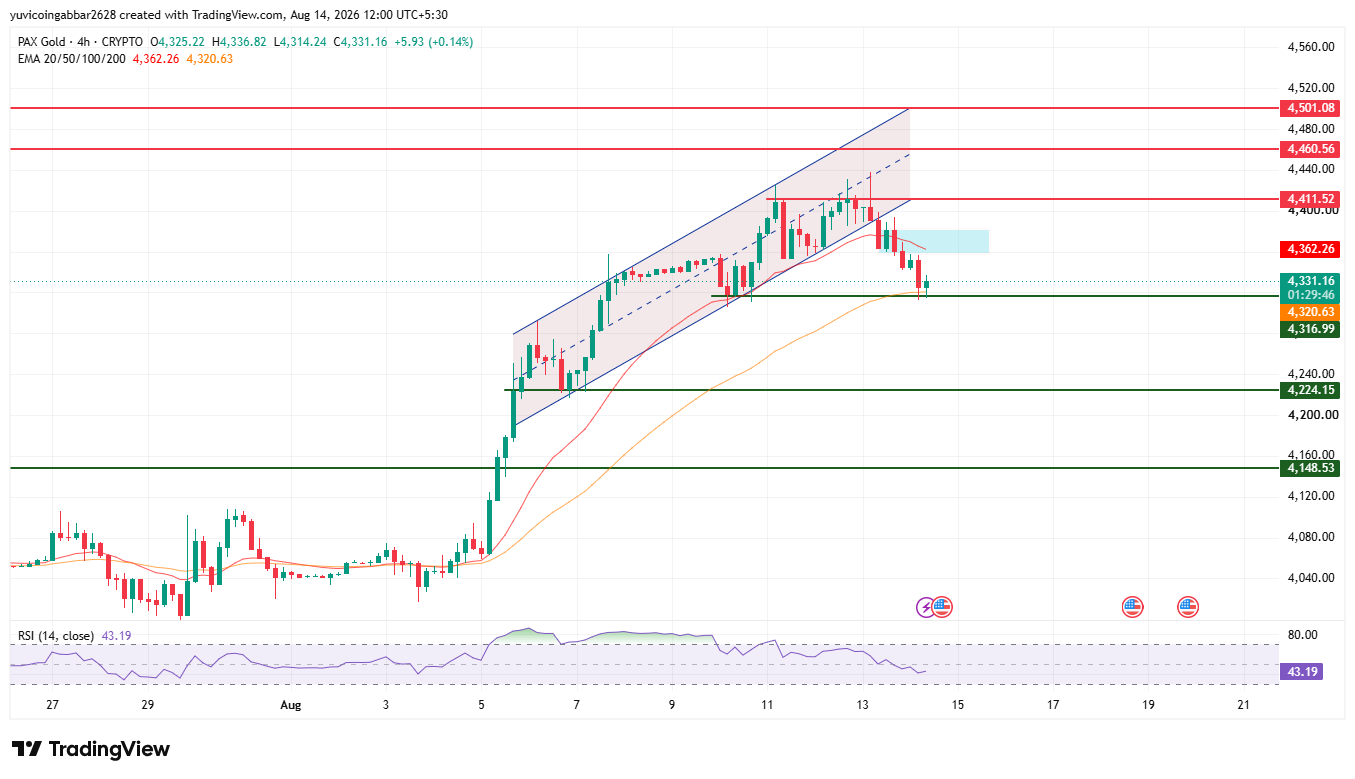
Support and Resistance Levels
Level Type | Price |
Resistance 3 | $4,501.08 |
Resistance 2 | $4,460.56 |
Resistance 1 (nearest) | $4,411.52 |
Immediate Price Reference | $4,331.16 |
First Confirmed Support | $4,316.99 |
Deeper Support | $4,224.15 |
Structural Floor | $4,148.53 |
EMA Levels
EMA | Price |
EMA 20 | $4,362.26 |
EMA 50 | $4,320.63 |
PAX Gold Price Prediction: Bull Case vs. Bear Case
PAXG price target 2026 Bull case: Holding above $4,316.99 and reclaiming EMA 20 near $4,362.26 would confirm this pullback is just a pause, not a reversal.
A confirmed close above $4,411.52 would open the path toward $4,460.56 and eventually $4,501.08.
PAXG price target 2026 Bear case: A close below $4,316.99 would put the rally in question and suggest the breakout is fading faster than expected.
Losing $4,224.15 would expose $4,148.53 as the next downside level.
PAXG Price Scenarios: Triggers and Invalidation
Scenario | Trigger | Likely Outcome | Invalidation Point |
Trendline reclaim | Close above $4,411.52 and above EMA 20 | Move toward $4,460.56, then $4,501.08 | Rejection back below $4,411.52 |
Channel hold | Price stays between $4,316.99 and $4,411.52 | Choppy, range-bound trading | Break of either boundary |
Channel breakdown | Close below $4,316.99 | Move toward $4,224.15, then $4,148.53 | Reclaim of $4,316.99 |
PAXG price target: Can PAXG Reach $4,501.08?
$4,501.08 is the highest resistance level marked on the chart. Reaching it would require PAXG to first reclaim $4,316.99 and EMA 20 near $4,362.26, then clear $4,411.52 and $4,460.56 in turn, a multi-stage move rather than a single leg.
What Could Invalidate the Bullish Setup?
A rejection at $4,411.52 followed by a close back below $4,316.99 would put the rally in question.
A deeper break below $4,224.15 and eventually $4,148.53 would suggest the pullback has turned into a real reversal, especially with long liquidations already elevated over the past 24 hours.
PAX Gold Price Prediction: Expert View
According to CoinGabbar analysts, PAXG is testing an important support zone right where $4,316.99 overlaps with EMA 50, after a sharp pullback from record highs near $4,411.52.
The heavy skew toward long liquidations over the past 24 hours shows this pullback is shaking out leveraged buyers, not just a quiet dip.
RSI at 43.19 leaves room either way without confirming a reversal yet.
Holding $4,316.99 keeps the bullish structure intact; losing it would open a deeper retest.
PAX Gold Price Prediction: Data Sources
Price, EMA, and RSI data referenced from a 4H PAX Gold/USD chart via TradingView, timestamped August 14, 2026, 12:00 UTC+5:30. Market cap, FDV, and supply data referenced from CoinMarketCap. Liquidation and futures exchange volume data referenced from Coinglass.
Disclaimer: This piece is for informational purposes only and isn't financial advice. The levels and scenarios above are based on technical chart analysis and publicly available data at the time of writing, and crypto markets can move sharply within hours, so past patterns don't guarantee future outcomes. It's worth doing independent research and considering your own risk tolerance before acting on any of the levels discussed here.

















