OpenEden Price Prediction: Why Is $EDEN Up 78% Today?


A chart that looked asleep for weeks just woke up in the loudest way possible. One token quietly slid inside a shrinking pattern for two months and then broke out overnight while almost nobody outside the chat rooms noticed until the candle was already green. This OpenEden price prediction looks at what actually pushed the token into the spotlight: does it have anything left to give?
Key Takeaways
EDEN traded near $0.0800, up roughly 78% in 24H after a technical breakout.
The move followed an Upbit listing on August 10 and a security certification.
24H volume hit $77.42M, a 2,146% jump versus prior activity.
RSI sits at 84.46, deep in overbought territory on the daily chart.
Whale wallets control 97.26% of supply, a real concentration risk.
EDEN Wakes Up: What Triggered OpenEden's Sudden Breakout
Here's the thing: nobody expected a real-world asset token tied to tokenized bond funds to be today's biggest mover. But that's exactly what happened.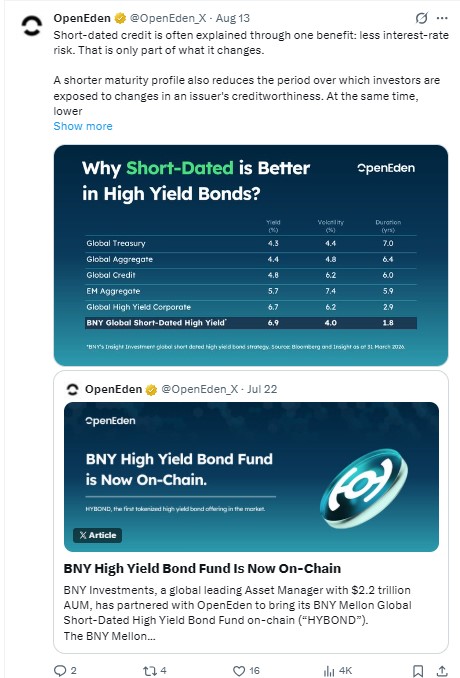
OpenEden (EDEN) isn't a random speculative coin. It's the project behind BNY's tokenized short-dated high-yield bond fund going on-chain, something OpenEden confirmed directly on X.

Upbit Confirms the Listing: Upbit Korea announced EDEN/BTC and EDEN/USDT market support starting August 10, 2026, at 14:00 KST, per its official X post.
And when a token with real institutional backing suddenly triples volume, traders pay attention fast. This piece breaks down the catalyst, the current price structure, the risk sitting under the surface, and what could happen from here.
Is this the start of a bigger move or a trap for late buyers?
Why Is OpenEden Price Moving Today?
The conversation around this move starts with one confirmed driver: a clean technical breakout above the $0.048 zone that had capped price since June.
That breakout didn't happen in a vacuum. EDEN's listing on Upbit, South Korea's largest exchange, landed on August 10, marking another notable crypto exchange listing for the RWA sector. Fresh liquidity followed. Then volume exploded.
We pulled up the order flow data, and the first thing that stood out was how concentrated the buying pressure looked. Binance alone processed over $208M in volume, according to CoinGlass heatmap data.
A recent ISO security certification added a fundamentals layer to the story too. It's not the main driver, but it gave holders another reason not to sell, especially with momentum building around the regulatory clarity bill moving through the Senate.
Turns out, most of this rally is exchange-driven momentum stacked on genuine news. Not pure hype. Not pure fundamentals either.
Where Is EDEN Price Right Now?
As of August 14, 2026, 10:00 AM UTC, EDEN traded at $0.0800, up 78.33% in 24H, according to CoinMarketCap price data.
Market cap sits near $32.44M against a fully diluted value of $80.58M. That gap matters, and we'll get back to it.
24H volume reached $77.42M, translating to a volume-to-market-cap ratio above 238%. That's extreme, and it's happening against a backdrop where the Fed meeting outlook is already adding volatility to short-term positioning across crypto. It usually means one thing: short-term traders, not long-term holders, are driving price right now.
The circulating supply stands at 402.62M EDEN out of a 1B max supply. Holder count sits at 11,810 wallets, a figure worth tracking on the coin events calendar as future vesting unlocks approach.
OpenEden Technical Analysis: The Daily Chart
A TradingView daily chart shows a falling wedge that formed from late June through mid-August, with lower highs converging against a flat support base near $0.0355.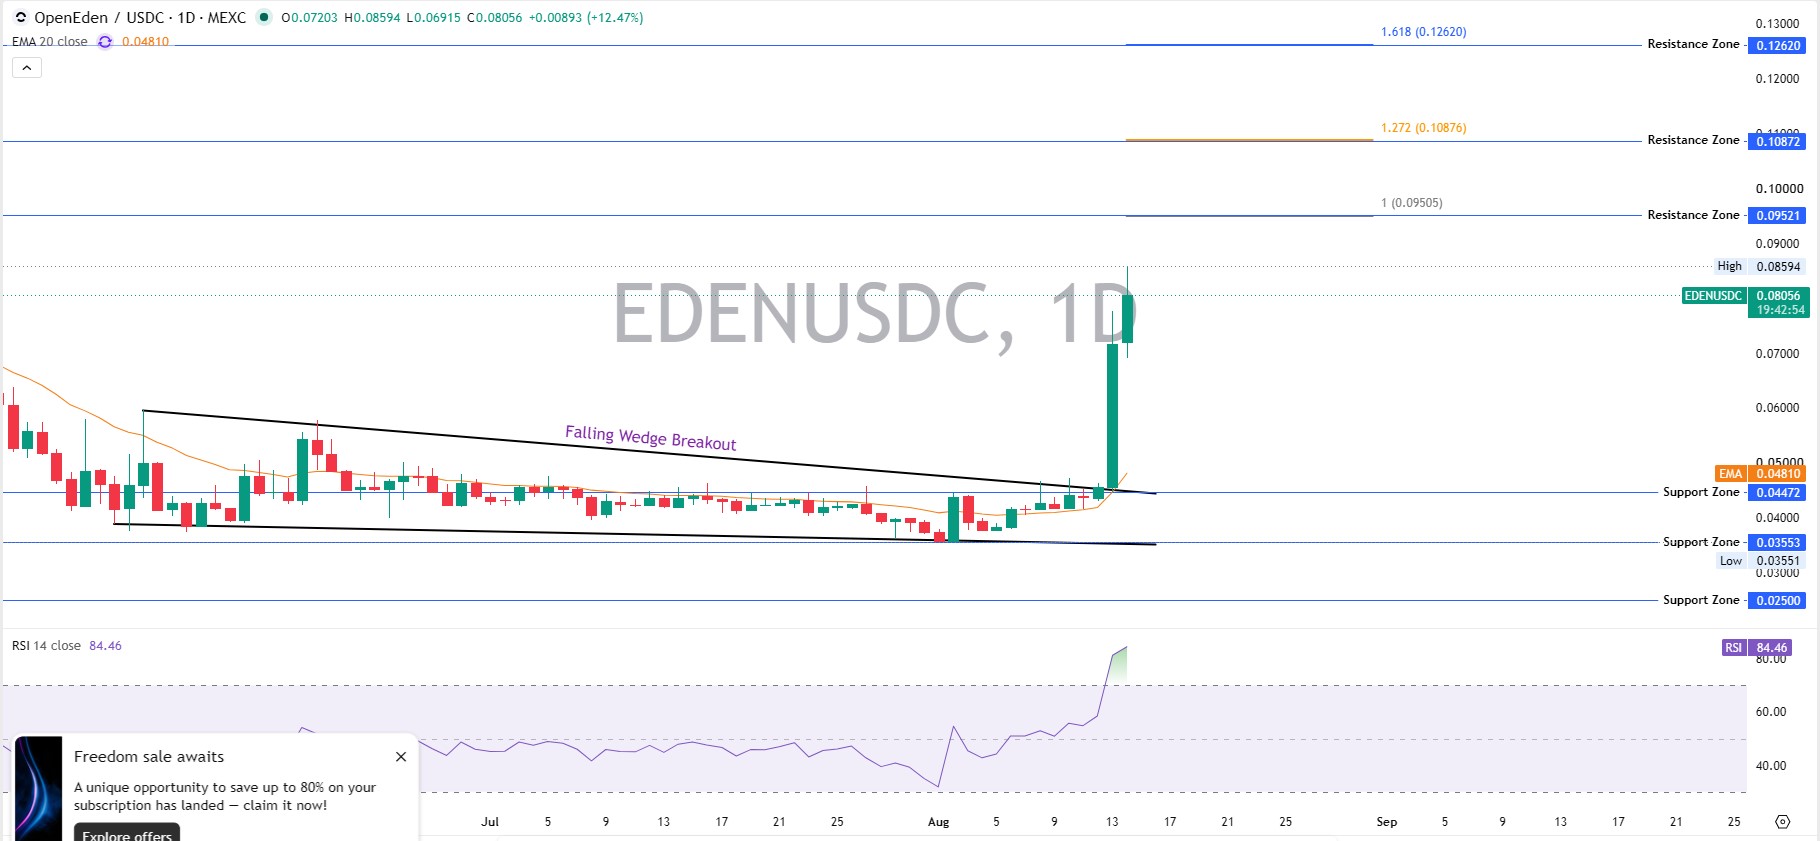
Price broke out of that wedge with a single large green candle, jumping from roughly $0.048 to a high of $0.0859 before settling near $0.0800. Volume on that candle dwarfed anything seen in the prior two months.
The EMA 20 sits at $0.0481, now acting as fresh support. RSI 14 reads 84.46 on the daily timeframe, well into overbought territory above the standard 70 threshold. That doesn't mean an immediate reversal. But it does mean upside from here likely needs a cooling-off period first.
Fibonacci extension levels place resistance at $0.09521 (1.0 extension), $0.10872 (1.272 extension), and $0.12620 (1.618 extension). On the downside, the wedge breakout point near $0.0447 becomes the first real support to defend.
Is OpenEden an Altcoin Worth Watching in the RWA Sector?
EDEN belongs to the real-world asset, or RWA, altcoin category, a segment that tokenizes traditional finance products like bonds and treasuries.
This isn't just another token riding memecoin market news; OpenEden's core product brings institutional credit products on-chain, and that positions it differently than most altcoins riding pure narratives.
That said, altcoin price behavior still applies here. EDEN moves with beta to broader crypto liquidity conditions, and a risk-off day in Bitcoin can still drag EDEN down regardless of its RWA fundamentals, especially with the Bitcoin price prediction 2026 outlook still contested among traders.
Tokenomics and Whale Concentration Risk
This is where the picture gets less comfortable. Etherscan holder data shows the top 10 wallets control 89.20% of supply. Whale wallets alone make up 97.26% of holdings, and the Gini distribution score reads 0.9982, close to maximum concentration.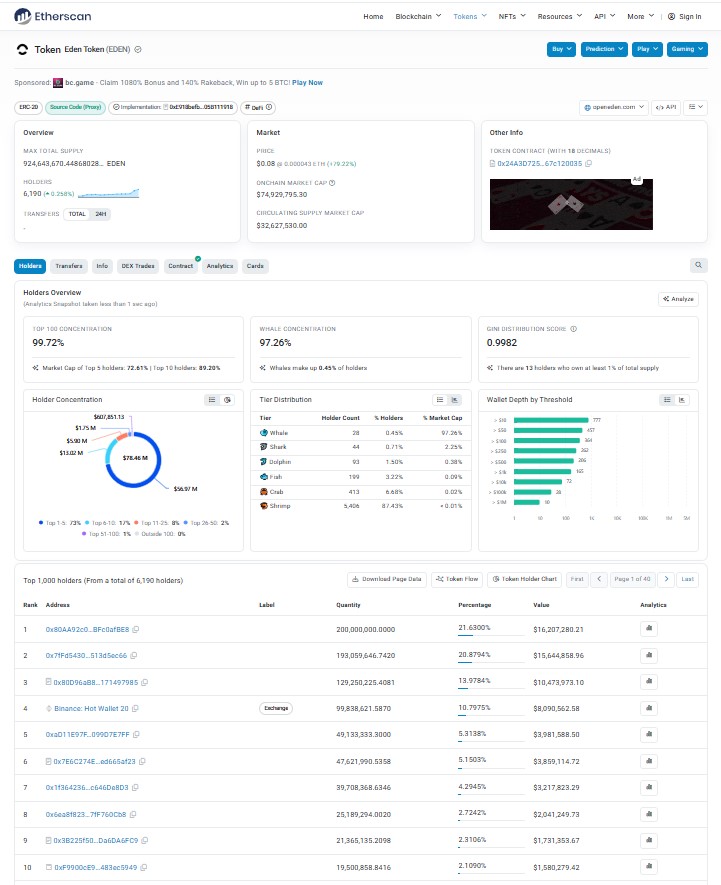
Some of that is exchange custody; some is treasury or vesting wallets. But without full wallet-category labeling, that concentration remains a genuine overhang. Traders hunting for early allocations elsewhere might find better risk-reward browsing a crypto airdrops list than chasing a token already this concentrated.
Liquidation data adds another wrinkle. 24H liquidations totaled $1.20M, with shorts taking the bigger hit at $852.16K versus $351.63K in long liquidations, a sign of a short squeeze feeding part of this rally.
OpenEden Price Prediction: Bear, Base, and Bull Scenarios
Timeframe | Bear Case | Base Case | Bull Case | Probability | Invalidation |
7 Days | $0.055 | $0.065 to $0.078 | $0.095 | Bear 30% / Base 45% / Bull 25% | Daily close below $0.0447 |
30 Days | $0.045 | $0.070 to $0.085 | $0.128 | Bear 30% / Base 40% / Bull 30% | Weekly close below EMA20 ($0.0481) |
Early 2027 | $0.035 | $0.075 to $0.110 | $0.160 | Bear 30% / Base 40% / Bull 30% | Loss of ascending trend structure |
The base case assumes EDEN consolidates as RSI cools, holding above the $0.0447 wedge breakout zone while the market digests the Upbit listing news.
The bull case needs sustained volume and a daily close above $0.09521, opening a path toward the $0.10872 and $0.12620 extension targets. A similar breakout dynamic is playing out across large caps too, with the Ethereum price prediction 2026 outlook drawing a comparable mix of optimism and caution.
The bear case triggers if profit-taking overwhelms new demand and price loses the EMA20 support near $0.0481, a pattern that often lines up with broader Bitcoin market trends, sliding back toward the prior range.
Key Risks for EDEN Holders
Extreme whale concentration remains the biggest structural risk here.
Overbought RSI conditions increase the odds of a sharp pullback before any continuation higher, a dynamic showing up across latest crypto news coverage more broadly this week.
Volume this elevated rarely holds. A drop in trading activity could expose thin order-book depth fast.
Glossary
RSI (Relative Strength Index): A momentum indicator measuring how fast and how far price has moved, with readings above 70 signaling overbought conditions.
FDV (Fully Diluted Valuation): What a token's total market cap would be if every token in the max supply were circulating today.
Gini Score: A statistical measure of wealth distribution; closer to 1 means fewer wallets hold more of the supply.
Conclusion
OpenEden's 78% move is real, backed by a genuine listing catalyst and confirmed on-chain volume data, arriving amid a broader wave of AI and crypto news shaping altcoin sentiment this month. But overbought RSI and heavy whale concentration mean the near-term outlook leans cautious, even with a constructive base case.
Disclaimer: This article is for informational purposes only and is not financial advice. Cryptocurrency markets are highly volatile.
Also read:

















