Bless Price Prediction 2026: Can $BLESS Hold Above $0.027?


Something odd just happened to a coin most traders had stopped checking. A quiet chart turned violent in a matter of hours, and now everyone wants to know if this is real strength or a setup for a harder fall. Small-cap tokens have a habit of luring people in right before the floor drops out from under them, and this one has whale wallets holding most of the supply, sitting right behind the excitement. So which is it this time?
Bless Price Prediction: Why BLESS Is Moving Today
Bless price prediction searches spiked after BLESS ripped higher and dragged short sellers into a wave of forced buying. Traders who had ignored this token for weeks are suddenly refreshing the chart every few minutes.
A move like this rarely comes out of nowhere. And it never stays quiet for long once it starts.
BLESS still carries real risk. A handful of wallets control almost all of the supply, and the token is nowhere near its all-time high from October 2025.
But the bounce off a fresh low, paired with heavy short covering, is the kind of setup that either fades fast or turns into a real trend. We wanted to know which one this looks like. Read on for the full breakdown, including where this coin might head from here.
Key Takeaways
Direction: Short-term momentum is bullish, but the rally looks squeeze-driven, not demand-driven.
Why it moved: Heavy short liquidations lined up with the breakout, per CoinGlass, with no confirmed listing or partnership news behind it.
Price now: Around $0.024, up roughly 77% in 24 hours, per CoinMarketCap.
Key support: $0.017, then $0.010.
Key resistance: $0.038, then $0.055.
Invalidation: A daily close under $0.017 breaks the bullish thesis. A close under $0.004, near the June low, confirms a bearish breakdown.
Data captured August 6, 2026, 06:30 UTC, from TradingView, CoinMarketCap, and CoinGlass.
Coin Overview
Bless (BLESS) is a token built around AI compute and agent infrastructure, tracked on Solana, per CoinMarketCap.
Metric | Value |
Token | Bless (BLESS) |
Blockchain | Solana |
Price (current) | $0.0242 |
Market Cap | $46.57M |
Fully Diluted Valuation (FDV) | $239.87M |
24H Volume | $41.78M |
Circulating Supply | 1.94B BLESS |
Max Supply | 10B BLESS |
Holders | 12.55K |
All-Time High | $0.2221 (Oct 16, 2025) |
All-Time Low | $0.003962 (Jun 6, 2026) |
What Actually Happened
What we can verify is liquidations. CoinGlass shows $6.27M in BLESS liquidations over 24 hours, and $4.45M of that came from shorts getting forced out. The 12-hour window alone saw $2.86M in short liquidations against $928.66K in longs.
BLESS had spent weeks grinding through a rounded bottom below $0.015. Shorts piled in during the fall. When the price ticked up, stops triggered, and shorts covered, and that buying fed on itself. It ties into the wider mood across risk assets too, something our Bitcoin bull-bear outlook touches on for majors right now.
Technical Analysis: 4-hour Chart
On the 4-hour chart, BLESS broke out of a rounded-bottom base that had held since early August, per TradingView. The breakout candle moved from roughly $0.017 to a high of $0.0273, and the day's range ran from a low of $0.0220 up to $0.0271.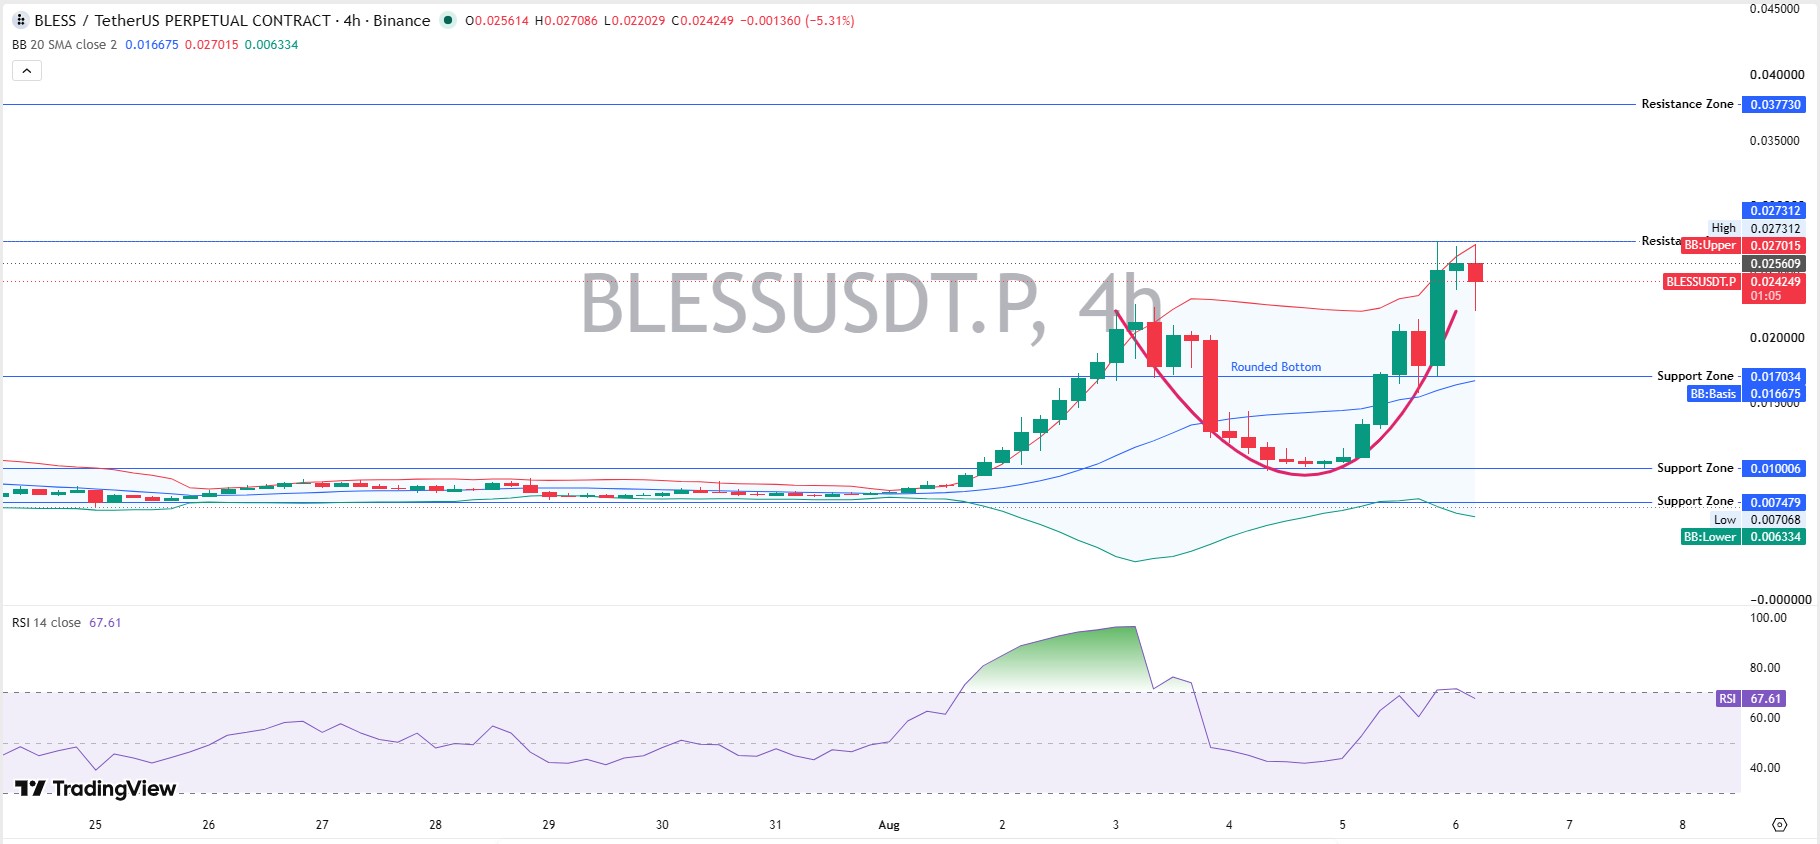
RSI, a momentum gauge that flags overbought conditions above 70, sits at 67.61 on the 4-hour timeframe. Hot, but not extreme yet, so there's still room before this stretches into blow-off territory.
Price is currently trading at $0.0242, down slightly from the intraday high near $0.0271. The 20-period basis on the Bollinger Band sits at $0.0167, and the upper band reads $0.0270, meaning price is riding close to the top of its own volatility envelope right now. That's a level that would need to hold for the breakout to stay intact.
A deeper pullback would land near $0.0100, the next visible support shelf below the basis line. Resistance sits at $0.0377. A push through that opens room toward $0.0546.
Technical Analysis: Weekly Chart
Zoom out, and the picture calms down. Weekly RSI reads 69.17, still shy of the overbought line most traders watch, even after a candle this large.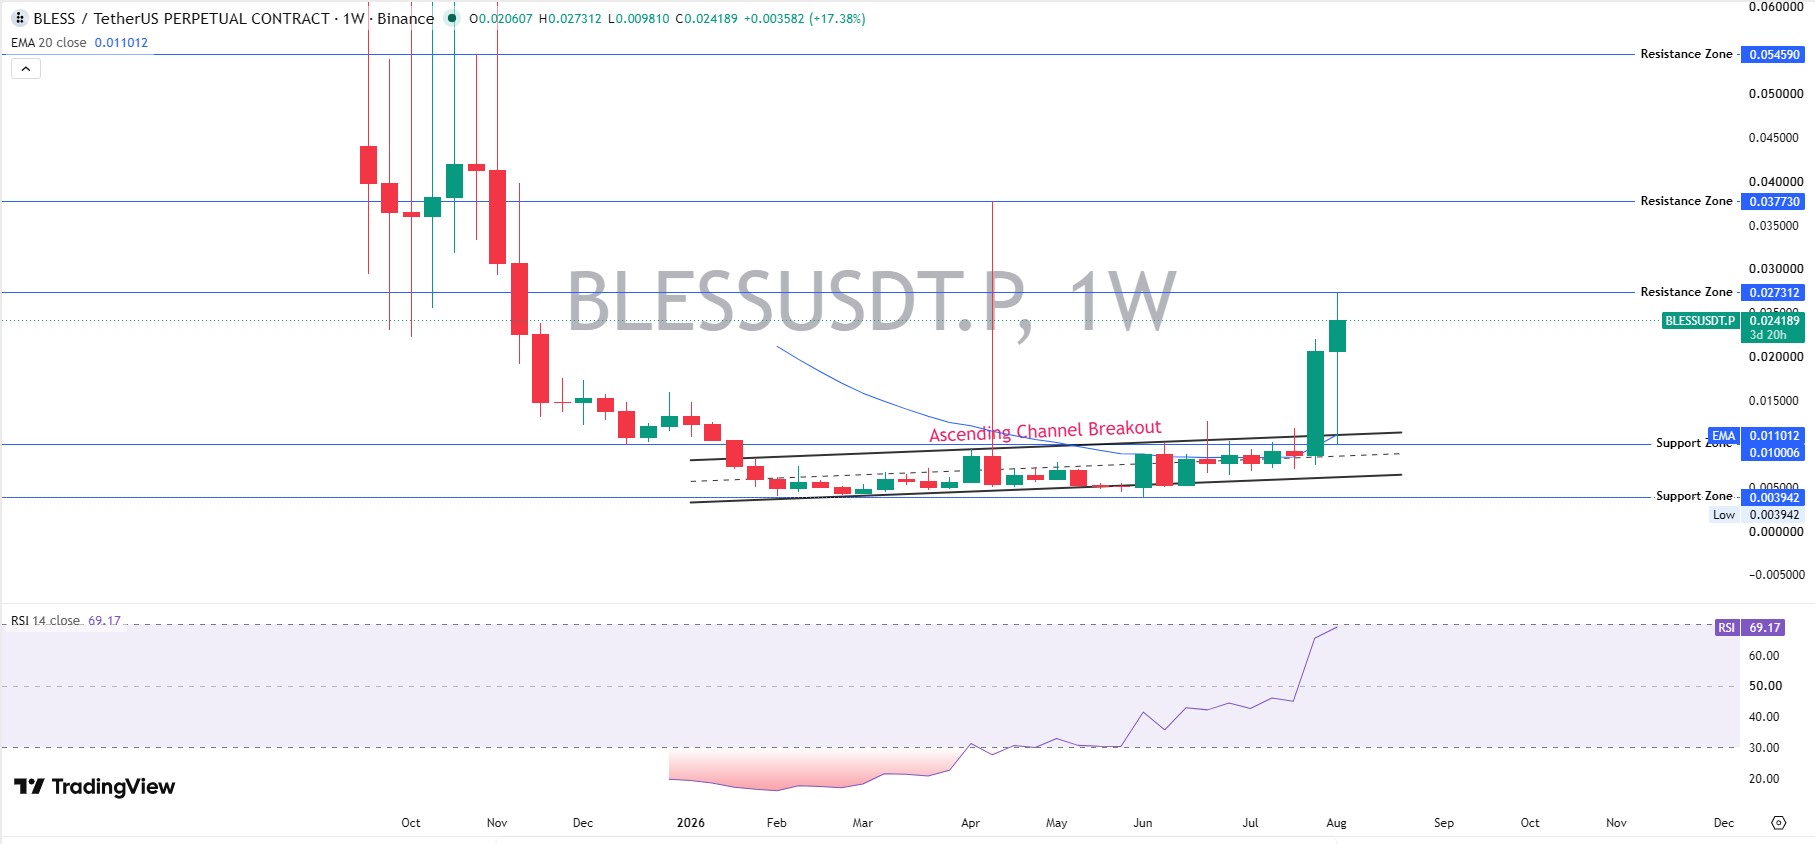
The weekly chart shows an ascending channel breakout, with price clearing a multi-month base that had capped BLESS since spring. The weekly close was up 17.38%, with the candle stretching from an open near $0.0206 to a high of $0.0273 and a weekly low of $0.0098.
Weekly EMA20 sits at $0.011, a wide gap below the current price. That gap is either a cushion or a magnet, depending on how this week closes, and it's worth watching since fast moves away from a rising average tend to snap back at least partway.
Support underneath sits near $0.0039, close to the token's all-time low, with a shallower shelf at $0.010 sitting in between. This is the level that flips a base case into a bear case.
On-Chain: Whale Concentration Is the Real Risk
We pulled the top holder list from Solscan, and it's lopsided. The top 10 wallets hold 96.44% of supply, worth roughly $226.48M.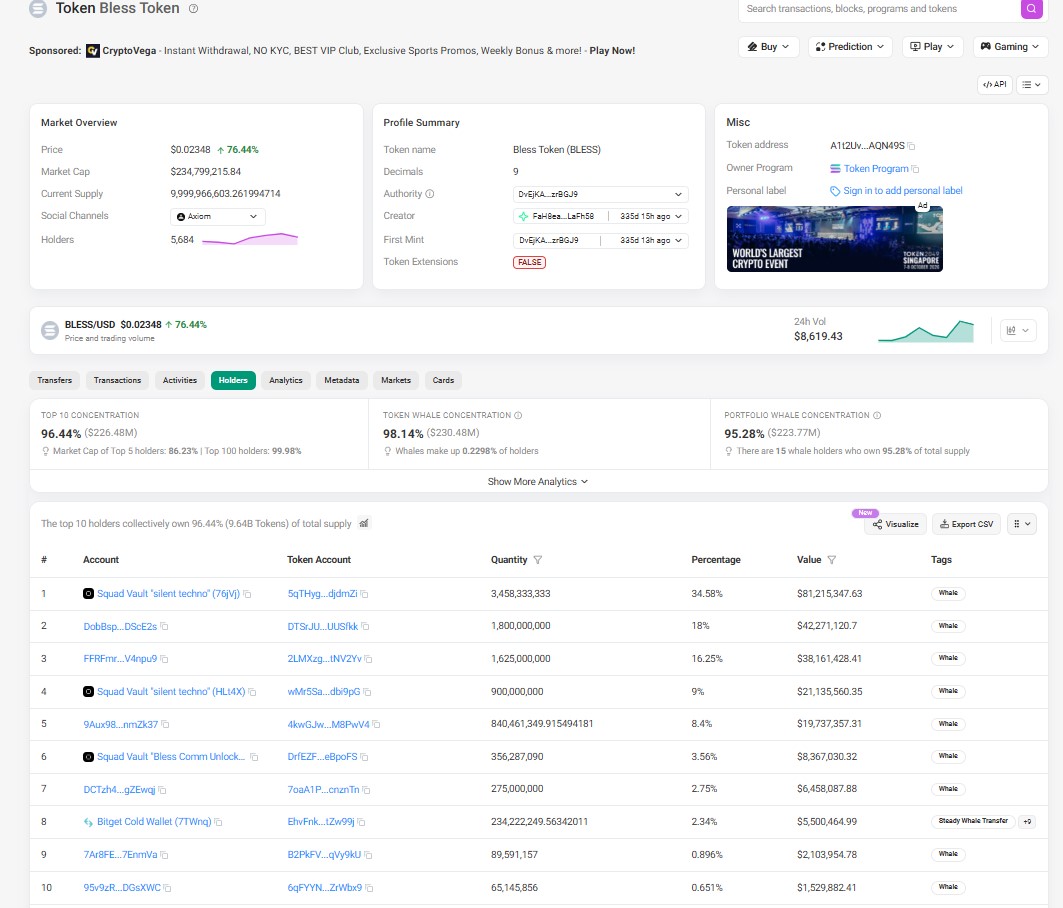
The single largest wallet, labeled "Squad Vault silent techno," holds 34.58% of the supply. A second address tagged with the same vault name holds another 9%. These look like vesting or treasury contracts rather than open-market whales, but that identity isn't confirmed on-chain, so treat it as a flag, not a fact.
Whale concentration overall is 98.14%, with just 0.2298% of holders controlling nearly all of the supply. That's thin. A market this concentrated can move hard in either direction on one wallet's decision.
Numbers aside, that's the single biggest risk sitting under this rally.
Bless in the Altcoin Market
BLESS trades as a small-cap altcoin, and altcoins this size tend to move faster than majors in both directions. Liquidity is thinner, so the same dollar amount moves the price more.
That's exactly what's playing out here. Compare that to how Ethereum's 2026 outlook reads calmer by contrast, simply because depth is deeper.
Altcoin rallies built on short covering tend to give back a chunk of the move once leveraged positions clear out. That doesn't mean the trend is dead. It just means the next few days matter more than the last twenty-four hours.
Tokenomics and Supply Risk
Approximately 19.4% of BLESS's maximum supply was reported as circulating at the checkpoint, per CoinMarketCap. The remaining supply may include locked, vested, reserved, unissued, or otherwise non-circulating tokens, and is the single biggest overhang on any long-term Bless price prediction.
FDV of $239.87M against a $46.57M market cap is a real gap. When more supply unlocks, that gap tends to close through price, not through market cap catching up.
Check a coin events calendar before trading around any single unlock date, since vesting schedules shift.
Scenarios by Timeframe
Timeframe | Bull Case | Base Case | Bear Case |
24H | Holds above $0.024, pushes toward $0.031 | Cools to $0.020-$0.022, RSI resets | Fails at $0.021, retests $0.017 |
7D | A weekly close above $0.028 flips structure bullish | Range-bound $0.018-$0.028 | Breaks $0.017, downtrend resumes |
30D | Volume holds; price tests $0.038 resistance | Drifts back to $0.015-$0.020 as squeeze fades | Unlock-driven selling drags price under $0.010 |
2026 | Sustained volume and AI narrative demand push toward $0.055-$0.08 | Stays rangebound as supply and adoption offset each other | Weak retention and heavy unlocks push BLESS toward its 2026 low |
Long-term numbers here are directional, not guarantees. They assume adoption keeps growing, which isn't confirmed yet.
Historical Context
BLESS peaked at $0.2221 on October 16, 2025, and remains roughly 89% below that high, per CoinMarketCap. It also printed a fresh all-time low of $0.003962 on June 6, 2026, before this rally started.
At current prices, BLESS sits about 490% above that June low. And yet it's still 89% under its all-time high. Both numbers are true at once, and they tell very different stories depending on which one you focus on.
Risks to Watch
Whale concentration tops the list, given how much supply sits in a handful of wallets. Futures-led speculation is another factor worth flagging clearly.
Exchange volume also leans heavily on one venue. Binance carries $838.10M of tracked volume, per CoinGlass's exchange heatmap, so any issue there hits liquidity fast. It's worth cross-checking against a broader crypto exchange listing view if you trade across venues.
Add ongoing unlock schedules and thin order books on smaller pairs, and volatility isn't calming down anytime soon.
Macro conditions matter too. Watch how the Fed rate decision shapes risk appetite across smaller tokens like this one.
The Clarity Act vote is another thread worth tracking, since regulatory clarity tends to move sentiment across the whole altcoin market, not just one token.
Methodology
Levels came from 4-hour and weekly TradingView charts for BLESSUSDT on Binance, using RSI-14, Bollinger Bands, and EMA20. Supply and market data came from CoinMarketCap. Liquidation and exchange-volume data came from CoinGlass. Holder concentration came from Solscan's top accounts list.
All figures were checked against the screenshots provided and are timestamped August 6, 2026, roughly 06:30 UTC. This piece focuses on the post-squeeze technical and whale-concentration picture, separate from the earlier short squeeze breakout coverage.
For context on the leg down that came before this bounce, the why is Bless down piece covers that stretch in more detail.
Disclaimer: This is speculative market commentary, not investment advice. Crypto assets are volatile and can lose most or all of their value. Do your own research before trading.


















